
When it comes to navigating the complex world of trading, basic trading technical indicators are touted as absolute game-changers, providing you with invaluable insights into market dynamics.
From the well-known moving averages to the intricate Bollinger Bands®, each indicator offers a unique perspective on price movements.
But how exactly do these indicators work together to help you make informed decisions in the market? Stay tuned to uncover the key characteristics of some essential technical indicators and how they can impact your trading strategies.
Essential Trading Indicators Overview
Essentially, trading indicators like moving averages and Bollinger Bands® offer valuable insights into stock price movements. Moving averages help smooth out price data to identify trends, while Bollinger Bands indicate potential price breakouts or reversals based on volatility.
Oscillators such as the Stochastic Oscillator, MACD, and RSI are crucial for assessing overbought or oversold conditions, guiding traders on potential entry or exit points. These indicators provide momentum signals and highlight market sentiment, aiding in decision-making.
Volume indicators like On-Balance Volume and money flow indicators like the Accumulation/Distribution Line complement these tools by confirming trends and predicting potential price shifts. By understanding and utilizing these indicators effectively, traders can enhance their market analysis and make informed trading decisions.
Key Characteristics of On-Balance Volume
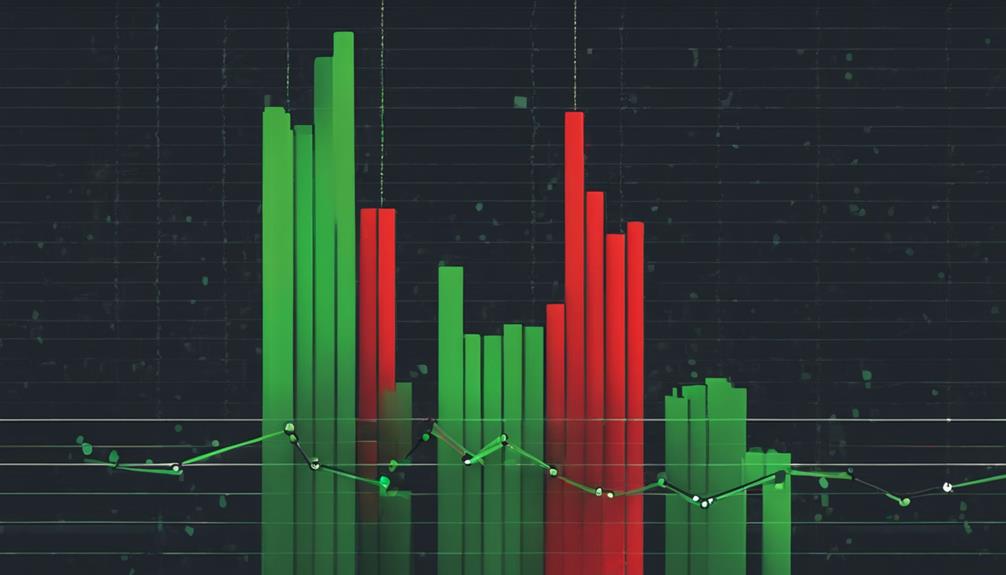
On-Balance Volume (OBV) serves as a crucial volume indicator, measuring the flow of positive and negative volume over time to reveal buying and selling pressure. Rising OBV indicates higher volume on up days, potentially forecasting price increases.
This tool assists in confirming trends and spotting possible trend reversals, offering valuable insights into market dynamics and price movements. Traders rely on OBV to assess the strength of price movements through volume analysis, enabling informed decision-making.
Understanding Accumulation/Distribution Line
The Accumulation/Distribution Line indicator provides insights into the flow of money based on price movements within the market. Traders leverage this indicator to analyze trends and make informed decisions regarding their trades. Here are five key points to understand about the Accumulation/Distribution Line:
- It measures the flow of money into and out of a security.
- Helps confirm trends by showing accumulation or distribution in the market.
- Rising values suggest accumulation and potential price increases.
- Falling values indicate distribution and potential price declines.
- Traders use it to validate trend strength and identify possible market reversals.
Understanding the Accumulation/Distribution Line empowers traders to navigate market dynamics and capitalize on money flow trends effectively.
Using Average Directional Index Effectively
Understanding how to effectively utilize the Average Directional Index (ADX) can significantly enhance your ability to gauge trend strength in the market. The ADX helps traders identify the strength of a trend without specifying its direction, with values above 25 indicating a strong trend and below 20 suggesting a weak trend.
By interpreting ADX values, traders can confirm trend strength, identify potential market reversals, and determine whether the market is in a ranging phase. Integrating the ADX with other indicators can offer insights for entering and exiting trades strategically based on trend confirmation.
Mastering the interpretation of ADX values is crucial for making informed trading decisions and maximizing your trading effectiveness.
Introduction to Aroon Indicator
Utilize the Aroon Indicator to assess trend strength and direction effectively in your technical analysis toolkit. The Aroon Indicator is a valuable technical analysis tool that helps you determine whether a security is in an uptrend or downtrend and the strength of that trend.
Here are some key points about the Aroon Indicator:
- It consists of two lines: Aroon-Up measures uptrend strength, while Aroon-Down measures downtrend strength.
- The indicator's values range from 0 to 100, with higher values indicating stronger trends.
- A crossover of Aroon-Up above Aroon-Down suggests a potential uptrend, and the opposite indicates a potential downtrend.
- Traders use the Aroon Indicator to confirm trends and identify trend changes for making informed trading decisions based on trend strength.
Are Basic Trading Technical Indicators and Basic Technical Indicators in Trading the Same Thing?
Yes, basic trading technical indicators and basic technical indicators in trading are referring to the same thing. Both terms are used interchangeably in the trading world to describe the fundamental indicators used to analyze and predict market trends and price movements. These indicators are essential for making informed trading decisions.
Frequently Asked Questions
What Are the Basics of Technical Indicators?
To understand the basics of technical indicators, you must grasp how these mathematical tools analyze price data to predict market trends. Combining indicators like moving averages and RSI gives you a clearer picture for informed trading decisions.
Which Indicator Is Best for Trading for Beginners?
For beginners, the best trading indicator is the Moving Average (MA). It helps you identify price trend directions accurately. Another valuable tool is the Relative Strength Index (RSI) for gauging momentum and overbought/oversold conditions.
What Are the Top 5 Technical Analysis Indicators?
In your trading journey, grasp the power of top 5 indicators: MA for trends, RSI for extremes, Bollinger Bands for volatility, MACD for momentum shifts, and Stochastic Oscillator for potential reversals. Explore, analyze, conquer.
What Are the 4 Types of Indicators in Trading?
Identify the 4 main types of trading indicators: Trend Following, Oscillators, Volume-Based, and Volatility Indicators. They help you understand market trends, overbought/oversold conditions, trading volume impact, and price movement speed. Mastering these can enhance your trading decisions.
Conclusion
In conclusion, basic trading technical indicators are indispensable tools for traders to analyze price movements and make informed decisions.
By utilizing indicators like On-Balance Volume, Accumulation/Distribution Line, Average Directional Index, and Aroon Indicator effectively, traders can gain valuable insights into market trends and momentum.
Incorporating these indicators in trading strategies can lead to more successful trades and ultimately, greater profits.
In short, mastering these indicators is like having a crystal ball for predicting market movements.