
If you're new to trading, you may not be aware that understanding basic candlestick patterns can significantly enhance your market analysis skills. These patterns can provide valuable insights into potential price movements and help you make more informed decisions.
Whether you're curious about which patterns are most reliable or looking to grasp the significance of bullish versus bearish formations, exploring these fundamental candlestick patterns is a crucial step in your journey towards mastering technical analysis.
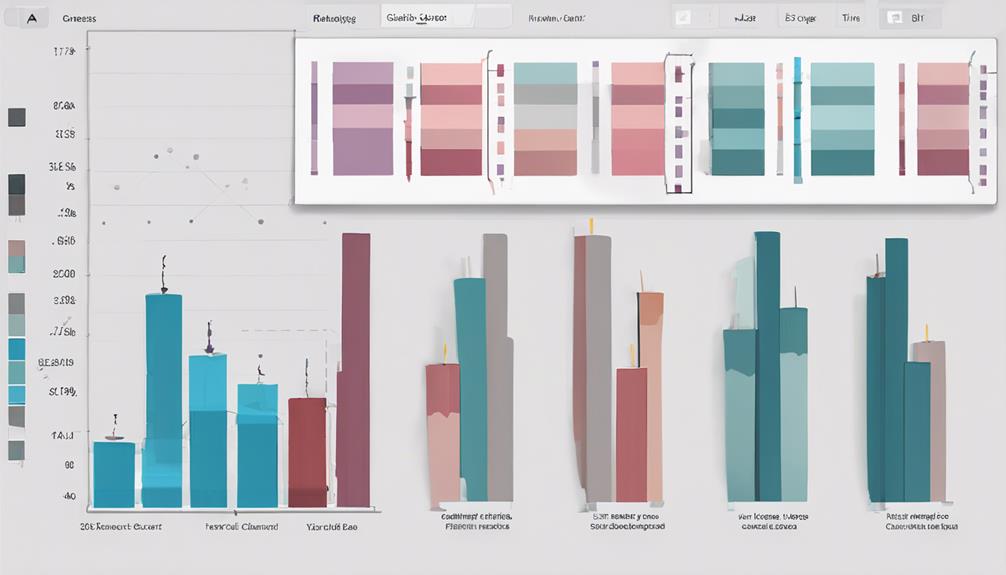
Candlestick Components Explained
To grasp the essence of candlestick patterns effectively, understanding the components – the upper shadow, real body, and lower shadow – is paramount for beginners.
Candlestick patterns are crucial in trading as they provide insights into market dynamics. The upper shadow reflects the range between the high and the closing price for bullish patterns or the open price for bearish patterns.
Meanwhile, the real body indicates the difference between the opening and closing prices, with color denoting the price direction. Lastly, the lower shadow represents the range between the low and the open price for bullish scenarios or the closing price for bearish scenarios.
Mastering these components enables beginners to interpret candlestick charts accurately and make informed trading decisions.
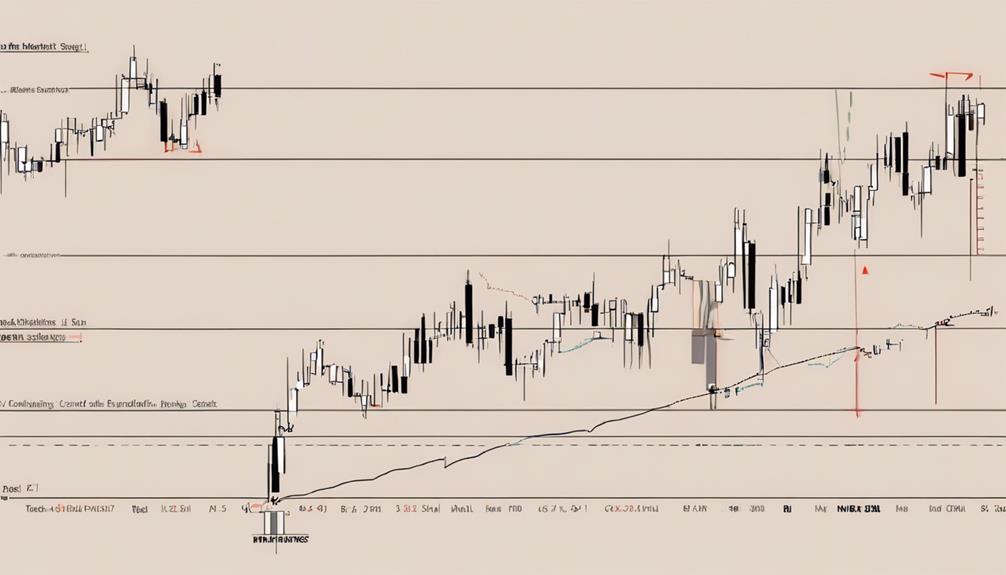
Candlestick Vs. Bar Charts Comparison
Comparing candlestick charts to bar charts reveals distinct differences in how price data is visually represented, influencing traders' preferences and decision-making processes.
Candlestick charts use visual elements like bodies and shadows to show open, high, low, and close prices, providing a detailed view of price movements and market sentiment. Traders often favor candlestick charts due to their effectiveness in displaying price trends and potential reversals.
In contrast, bar charts represent price data with lines for opening and closing prices without the same visual representation of candlestick patterns. The color and shape of candlesticks offer quick insights into market dynamics, aiding traders in making informed decisions based on the visual cues provided.
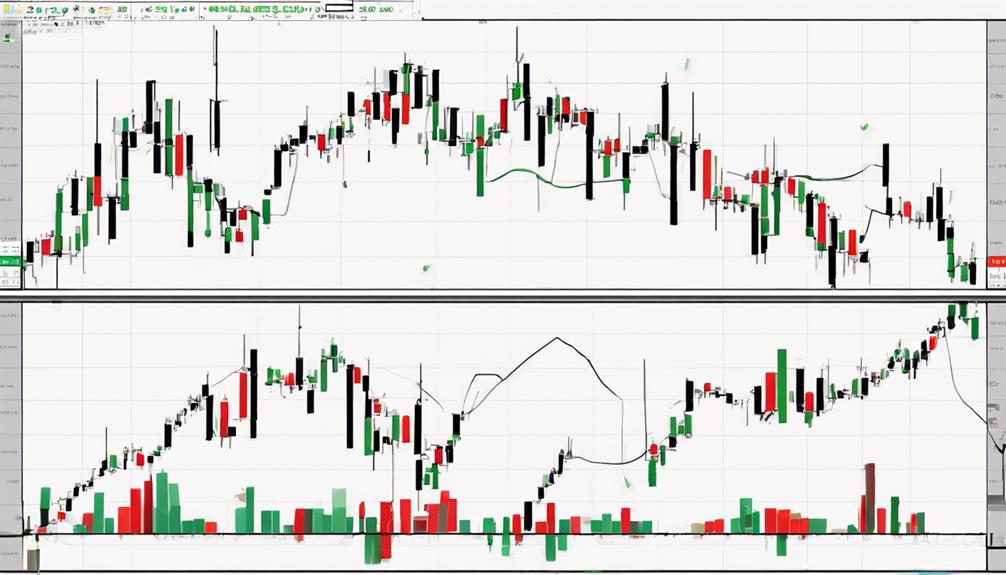
Bearish Candlestick Patterns Overview
When examining bearish candlestick patterns, traders assess potential price declines in the market as indicators of selling pressure and impending trend reversals.
Examples of bearish patterns like Bearish Engulfing, Hanging Man, and Shooting Star signal a possible shift from an uptrend to a downtrend.
Recognizing these patterns is crucial for identifying opportunities for short positions. By understanding bearish candlestick patterns, traders can effectively manage risk and make informed trading decisions in a bearish market.
It's essential to utilize these patterns in conjunction with other technical analysis tools to increase the probability of successful trades and navigate the complexities of market fluctuations.
Mastering bearish patterns enhances a trader's ability to adapt to changing market conditions and capitalize on potential downturns.
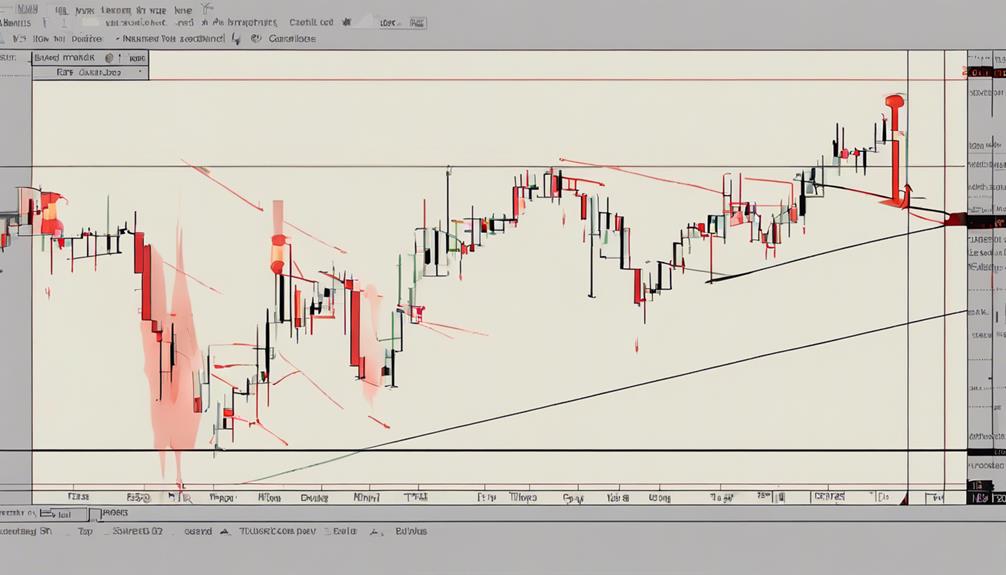
Bullish Candlestick Patterns Overview
In bullish markets, recognizing and understanding bullish candlestick patterns is crucial for identifying potential price reversals and seizing profitable trading opportunities. Examples of bullish candlestick patterns like the Hammer, Inverse Hammer, and Bullish Engulfing indicate a shift in market control to buyers, showing increased buying pressure.
These patterns typically appear during uptrends, signaling potential entry points for traders looking to establish long positions. By mastering these bullish candlestick patterns, traders can enhance their trading strategies and make more informed decisions when navigating the market.
Understanding the dynamics of these patterns is essential for traders aiming to capitalize on upward price movements and optimize their trading performance.
Most Accurate Candlestick Pattern
For traders seeking reliable indicators in candlestick patterns, identifying the most accurate one is a subjective process influenced by individual strategies and market conditions. When considering the most accurate candlestick patterns, traders often look at specific ones like:
- Bullish Engulfing
- Morning Star
- Three White Soldiers
The accuracy of these patterns depends on various factors such as market conditions, timeframe, and confirmation from other technical analysis tools. Additionally, patterns like Hammer, Piercing Line, and Dark Cloud Cover are also valued by some traders for their predictive abilities. Continuous practice and observation of different candlestick patterns can assist traders in determining the most effective and accurate ones that align with their trading style.
How Can Beginners Use Basic Candlestick Patterns in Their Trading Strategy?
Beginners can improve their trading strategy by applying candlestick patterns effectively. By learning the basics of popular patterns like doji, hammer, and engulfing, traders can make informed decisions about when to buy or sell. Understanding these patterns can provide valuable insight into potential market trends and price movements.
Frequently Asked Questions
What Are the Basics of Candlesticks?
Understand candlestick basics to interpret charts effectively. Each candle shows open, high, low, close prices. Real body, upper, lower wicks illustrate price movement. Bullish candles close higher, bearish lower. Analyze market sentiment for informed trading decisions.
What Is the 3 Candle Rule?
Imagine a compass guiding your way through market waters – the 3 Candle Rule acts as your navigator. Three consecutive candles hint at trend shifts. Three White Soldiers signal bullish optimism, while Three Black Crows warn of bearish clouds ahead.
What Is the Most Common Candlestick Pattern?
The most common candlestick pattern is the Doji. It indicates market indecision and potential trend reversal. Doji candles have almost equal open and close prices, with upper and lower wicks. Traders interpret Doji patterns as signals of uncertainty and equilibrium.
How to Learn Candlestick Easily?
To learn candlestick patterns easily, immerse yourself in educational resources like tutorials and charts. Absorb knowledge like a sponge, practicing on historical data and real-time charts. Combine learning with application for a deeper understanding.
Conclusion
In conclusion, mastering basic candlestick patterns is essential for beginner traders to interpret price movements effectively.
By understanding the components of candlesticks, comparing them to bar charts, and recognizing key bullish and bearish patterns, traders can make more informed decisions.
Remember, these patterns act as a roadmap guiding you through the ups and downs of the market, like a lighthouse guiding ships through stormy seas.
Keep learning and practicing to sharpen your trading skills.