
To master the art of trend following indicators, remember these five fundamental tips for success.
Starting with a solid understanding of moving average indicators sets the stage for accurate trend identification.
Incorporating dynamic support and resistance indicators can offer valuable insights into market direction shifts.
Furthermore, exploring trend strength indicators allows for gauging the market's momentum effectively.
Additionally, leveraging market condition prediction indicators can help filter out unwanted noise.
Lastly, combining various indicators and adjusting settings could be the key to unlocking precise trend-following strategies.
Curious to unravel the secrets behind optimizing your trend following game?
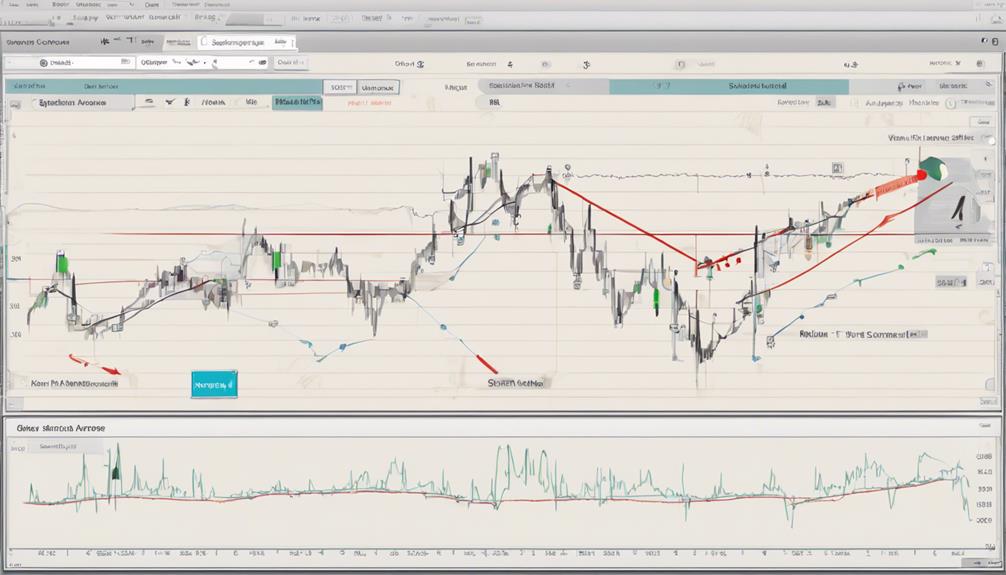
Moving Average (MA)
When implementing trend-following strategies, understanding the Moving Average (MA) indicator is crucial for smoothing price fluctuations and identifying trends effectively.
The Simple Moving Average (SMA) calculates the average price over a specified period, aiding in determining trend direction. On the other hand, the Exponential Moving Average (EMA) reacts quicker to price changes by assigning more weight to recent data points.
By combining different period EMAs, traders can gauge trend strength and potential reversals more accurately. MA indicators like SMA and EMA serve as valuable tools for trend-following strategies, offering insights into market trends and optimal entry/exit points.
Utilizing these indicators enhances your ability to navigate market trends and make informed trading decisions based on trend analysis.
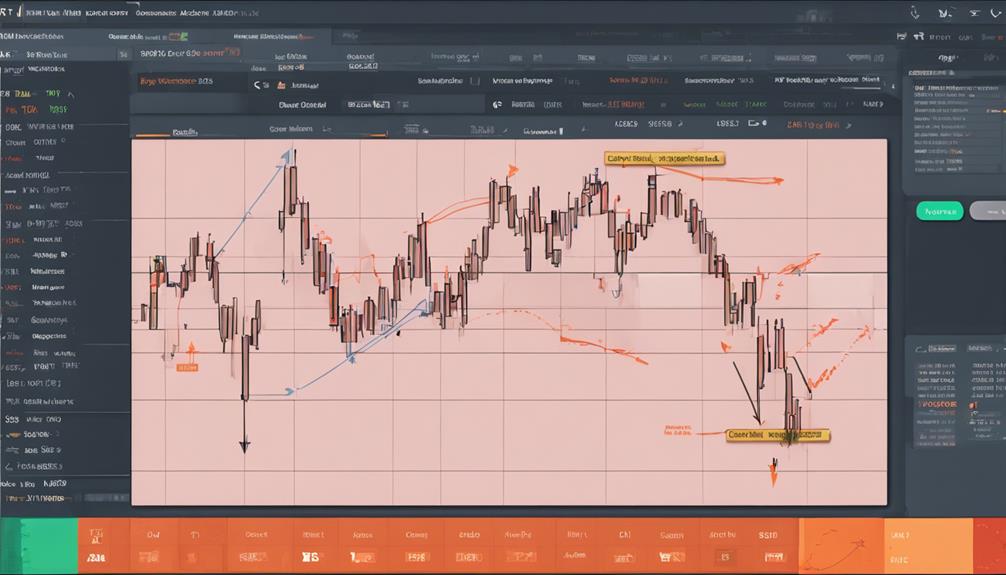
MACD Indicator
The MACD Indicator, short for Moving Average Convergence Divergence, is a powerful tool that compares two moving averages to pinpoint trend changes and momentum shifts. It consists of the MACD line, which is the variance between two Exponential Moving Averages (EMAs), and the signal line, an EMA of the MACD line.
By analyzing crossovers between these lines, traders can identify potential buy or sell signals, indicating shifts in momentum. Additionally, observing divergences between price action and the MACD can signal upcoming trend reversals.
This makes the MACD a valuable tool for trend following strategies, offering insights into market dynamics and potential entry or exit points based on the relationship between these key indicators.
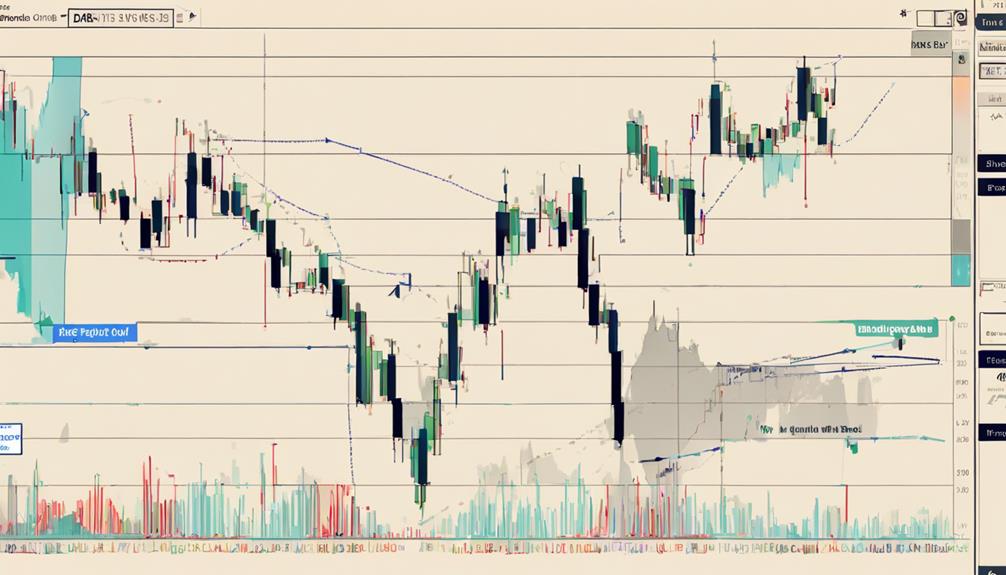
Parabolic SAR
Parabolic SAR, a dynamic indicator based on price momentum, provides crucial support and resistance levels for traders. When utilizing Parabolic SAR, consider the following:
- Identifying Trend Reversals: The dots of the Parabolic SAR appearing above or below the price indicate potential trend reversals.
- Managing Positions and Trailing Stops: Traders can use Parabolic SAR to manage positions effectively by setting trailing stops based on the indicator's levels.
- Confirming Trend Direction: It helps confirm the direction of the trend, assisting traders in making informed decisions.
Average Directional Index (ADX/DMS)
To effectively gauge trend strength and direction in your trading strategies, consider integrating the Average Directional Index (ADX/DMS) indicator, a powerful tool that measures trend intensity and filters out weak market movements.
The ADX quantifies the strength of a trend on a scale of 0-100, with readings above 25 suggesting a robust trend. By analyzing the Positive Directional Indicator (+DI) and Negative Directional Indicator (-DI), traders can determine the direction of the trend.
Watch out for crosses between the +DI and -DI lines, as they may signal potential trend changes. Utilizing the ADX helps filter out weak trends, enabling you to focus on strong and sustainable market movements.
Combine ADX with other indicators like moving averages to confirm trend strength before making important trading decisions.
Smooth Trend Finder
Smooth Trend Finder, a custom indicator designed to analyze recent price movements, offers valuable insights for anticipating future price changes in trading strategies. Here are three key aspects to consider when utilizing the Smooth Trend Finder in your trading approach:
- Timely Entries and Exits: The indicator generates alerts based on recent data analysis, aiding traders in making well-timed entry and exit decisions.
- Market Condition Identification: Smooth Trend Finder helps in identifying market conditions, such as sideways movements, enabling traders to adapt their strategies accordingly.
- Filtering False Signals: This indicator effectively filters out market noise and false signals, enhancing the accuracy of trend-following strategies when combined with other indicators.
When incorporating the Smooth Trend Finder into your trading toolkit, consider these elements to optimize your trading decisions.
Are the Essential Tips for Trend Following Indicators the Same as the Key Principles?
When considering key principles trend following indicators, it’s important to note that the essential tips for using these indicators effectively align with the overarching principles. Both emphasize the importance of identifying trends, setting clear entry and exit points, and managing risk to maximize potential returns in the market.
Frequently Asked Questions
What Is Trend-Following Indicator Strategy?
Trend-following indicator strategy involves using technical tools to track market trends for trading opportunities. It focuses on capturing existing trends, not predicting future prices. These indicators help you determine trend direction and strength, aiding in informed trading decisions.
What Are the Indicators for Determining Trend?
To determine trends, consider indicators like Moving Average, Bollinger Bands, MACD, RSI, and On Balance Volume. Each tool analyzes different aspects of price movements, providing valuable insights for making informed trading decisions.
What Are the Trend-Following Rules?
Identify trend direction through moving averages, trendlines, and momentum indicators. Buy in uptrends, sell in downtrends. Following trend rules involves capturing profit potential, avoiding counter-trend trades. Stick to trend signals for informed decisions and reduced emotional trading.
What Is the Indicator of a Trend?
To identify a trend, look for consistent price movement in one direction over time. Trend indicators like moving averages or MACD can help confirm if the market is in an uptrend, downtrend, or sideways trend.
Conclusion
In conclusion, mastering the art of trend-following indicators is like navigating a complex maze with precision and finesse.
By understanding the nuances of moving averages, dynamic support and resistance indicators, trend strength indicators, and market condition prediction tools, you can elevate your trading strategy to new heights.
So, embrace the challenge, embrace the data, and embrace the euphoria of successful trend-following in the dynamic world of trading.