
When navigating the realm of trading, utilizing the Bollinger Bands indicator is akin to having a compass in a vast sea of market fluctuations.
Understanding the nuances of this powerful tool can significantly enhance your trading prowess.
By exploring five of the best ways to leverage Bollinger Bands effectively, you will gain valuable insights that can potentially elevate your trading strategies to new heights.
Let's explore these strategies together and uncover how you can optimize your trading decisions with this versatile indicator.
Bollinger Bands Calculation and Interpretation
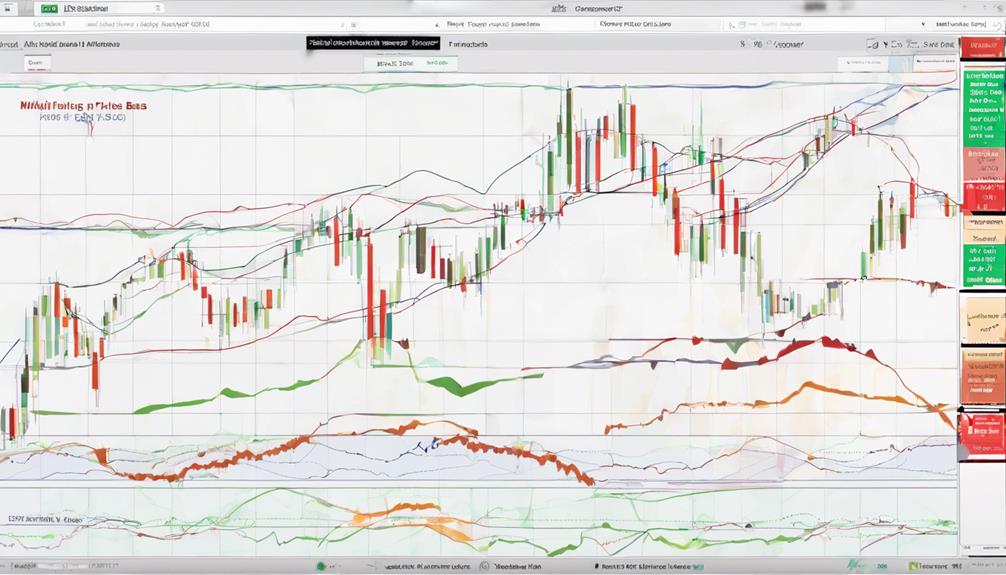
To calculate and interpret Bollinger Bands effectively, start by understanding that they derive from a 20-day simple moving average as the middle band.
The upper Bollinger Bands are calculated by adding 2 times the daily standard deviation to the middle band, while the lower bands are calculated by subtracting 2 times the daily standard deviation from the middle band.
These bands serve as a valuable indicator in trading, helping to identify overbought conditions when prices touch the upper band and oversold conditions when prices touch the lower band.
By dynamically adjusting to price changes, Bollinger Bands offer insights into price volatility and potential trend reversals.
Understanding these calculations is crucial for utilizing this indicator effectively in your trading strategies.
Utilizing Multiple Bands for Analysis
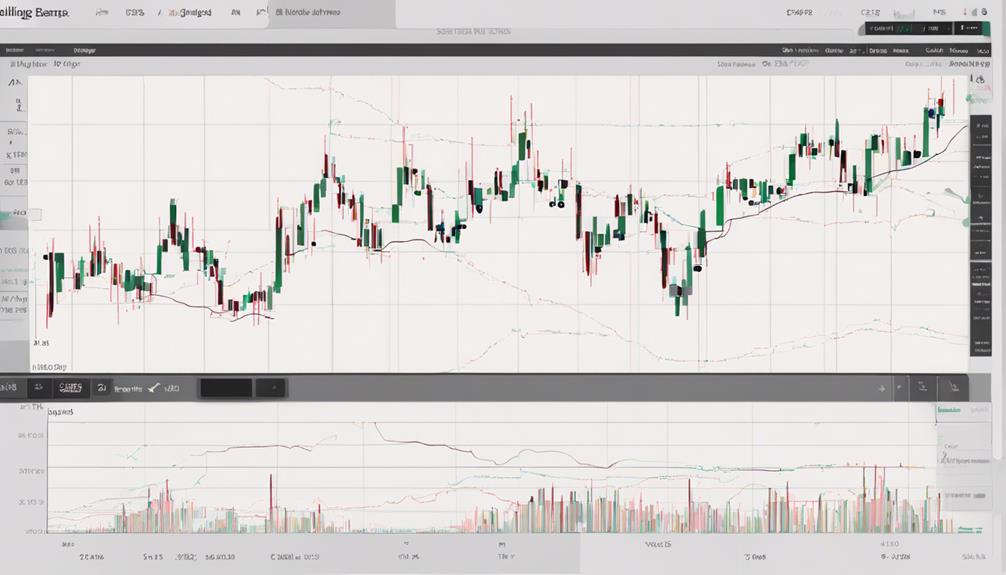
Enhance your trend analysis by incorporating multiple bands alongside standard Bollinger Bands for a more comprehensive understanding of price movements and potential trend reversals. By adding multiple bands, you can strengthen trend analysis, pinpoint price movement divergence, and identify possible trend reversals more effectively.
These additional bands also help in assessing price volatility levels and recognizing breakout points. Utilizing various sets of Bollinger Bands across multiple timeframes allows for a holistic view of price action, aiding in confirming trend direction.
Through the observation of convergence and divergence in price movements with multiple bands, traders can make more informed decisions when trading. Incorporating multiple bands provides a deeper insight into market dynamics and enhances the utility of Bollinger Bands in your analysis.
Trend Trading With Bollinger Bands
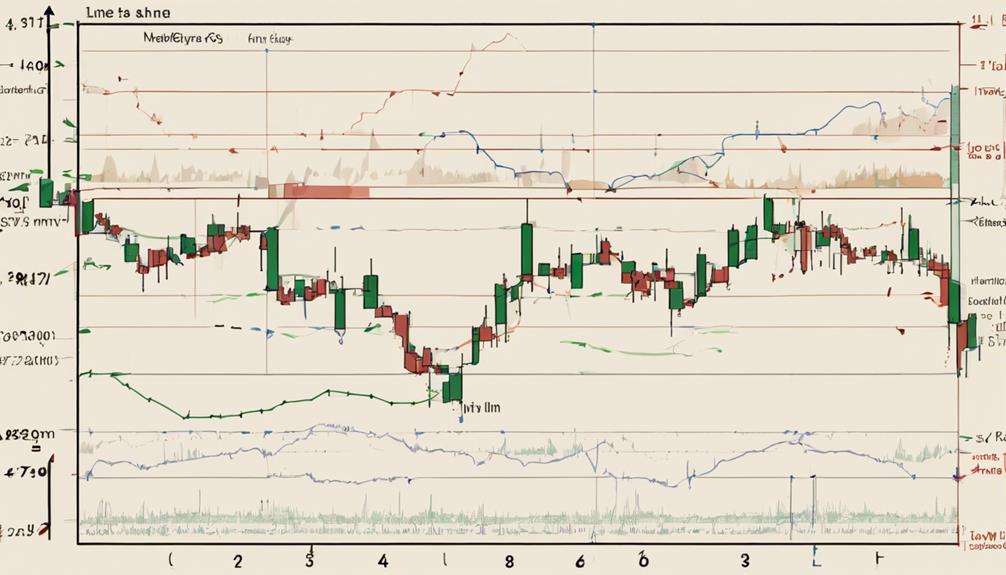
Utilizing Bollinger Bands for trend trading involves identifying price trends through the observation of the price's position relative to the bands. Traders can capitalize on market momentum by going long in uptrends when the price touches the lower band and shorting in downtrends when the price touches the upper band. This strategy focuses on buying low and selling high based on the established trend, utilizing the moving average within the Bollinger Bands to generate buy and sell signals.
Additionally, trend traders use the bands to set stop-loss points, taking into account market volatility levels for effective risk management.
- Bollinger Bands aid in identifying price action within trends
- Traders can use the upper and lower bands for buy and sell signals
- Setting stop-loss points based on market volatility helps manage risk efficiently
Bollinger Bands Squeeze Strategy
When implementing the Bollinger Bands Squeeze Strategy, traders look for periods of low volatility as a precursor to potential price breakouts.
This strategy involves waiting for the bands to narrow, signaling reduced price movement and indicating a forthcoming volatility expansion.
Traders anticipate significant price movements and aim to capitalize on explosive price action following periods of consolidation.
By focusing on capturing price momentum after tight trading ranges, the Bollinger Bands Squeeze Strategy seeks to benefit from sharp price movements that often follow these periods of decreased volatility.
This approach allows traders to position themselves to potentially profit from dynamic market shifts triggered by the release of pent-up volatility.
What Are Some Advanced Strategies for Using the Bollinger Bands Indicator?
When it comes to making the most of the Bollinger Bands indicator, having the best bollinger bands insights is crucial. Advanced strategies include using multiple time frames, combining the indicator with other tools, and identifying divergence patterns. These insights can help traders make more informed decisions and improve their trading results.
What are some advanced ways to utilize the Bollinger Bands indicator?
Some advanced ways to utilize the Bollinger Bands indicator include identifying trend reversals, analyzing volatility, and predicting potential price breakouts. These insights into bollinger bands can help traders make more informed decisions and maximize their trading strategies.
Bollinger Vs. Keltner: Comparison
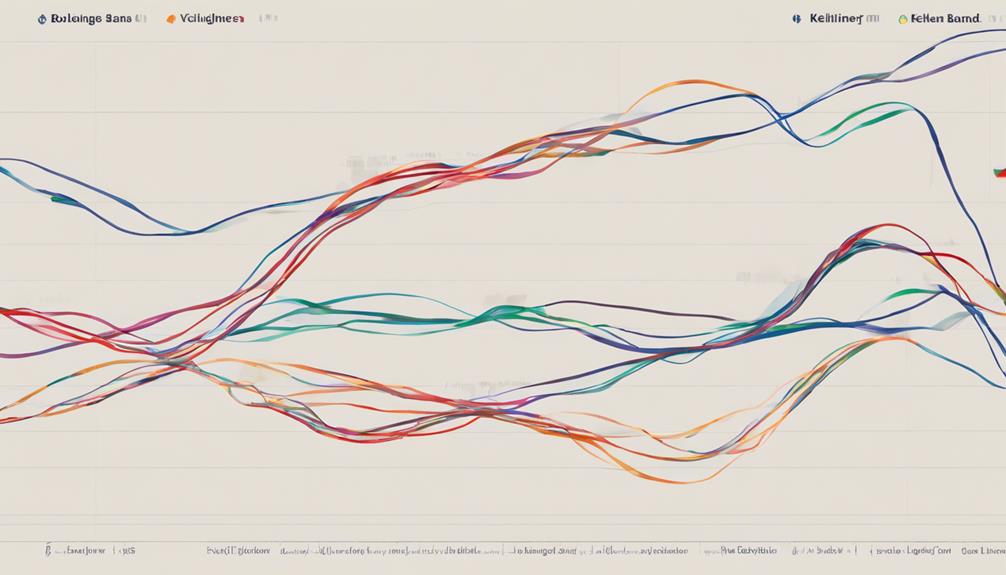
Comparing Bollinger Bands and Keltner Channels reveals distinct differences in their volatility measurement and signal generation methods, influencing traders' preferences based on individual trading styles and objectives.
When evaluating Bollinger Bands and Keltner Channels:
- Bollinger Bands use standard deviation, while Keltner Channels use average true range (ATR) for volatility measurement.
- Both indicators help identify overbought and oversold conditions, but Keltner Channels generate more signals due to ATR calculations.
- Traders may prefer one indicator over the other based on personal trading styles and preferences.
Although both indicators serve to identify price extremes, the calculation methods of Bollinger Bands and Keltner Channels present significant differences in their approach.
Frequently Asked Questions
How Do You Use Bollinger Bands Effectively?
To use Bollinger Bands effectively, look for price touches on the upper/lower bands within a set period, but remember this isn't a direct trade signal. By combining them with other indicators and chart patterns, you can make more informed trading decisions.
What Is the Best Indicator to Use With Bollinger Bands?
To maximize Bollinger Bands, the Relative Strength Index (RSI) is a top choice. RSI complements Bollinger Bands by pinpointing overbought/oversold conditions. Adjust RSI and Bollinger Bands settings to align with your trading style. Look for trend reversals by watching the RSI line at 50.
What Is the Best Moving Average to Use With Bollinger Bands?
You'll find the 20-day simple moving average to be your trusty sidekick with Bollinger Bands. It's your beacon in the sea of price fluctuations, guiding you with its balance of responsiveness and smoothing for trend spotting.
How Do You Use the %B Indicator?
To use the %B indicator, monitor values above 1 indicating price above upper band and below 0 below the lower band. Identify overbought (close to 1) and oversold (close to 0) conditions for potential reversals.
Conclusion
You now have the tools to master the Bollinger Bands indicator and enhance your trading strategies. By understanding its calculation, interpretation, and various strategies, you can confidently navigate the market with precision. Combine it with other technical analysis tools for even greater insight.
With the power of Bollinger Bands at your fingertips, you'll be unstoppable in identifying profitable trading opportunities. Start using this versatile indicator today and watch your trading success skyrocket!