
Imagine navigating through a dense fog, trying to discern the path ahead. Just as clarity is crucial in such a scenario, mastering the Ichimoku Cloud Indicator can provide you with a clear view of market trends and potential opportunities.
By understanding how each component interacts and influences price action, you can unlock the full potential of this powerful tool.
Ready to uncover the secrets to using the Ichimoku Cloud Indicator effectively and taking your trading to the next level?
Understanding Ichimoku Cloud Indicator
To grasp the intricacies of the Ichimoku Cloud indicator, one must delve into its components and their functions meticulously.
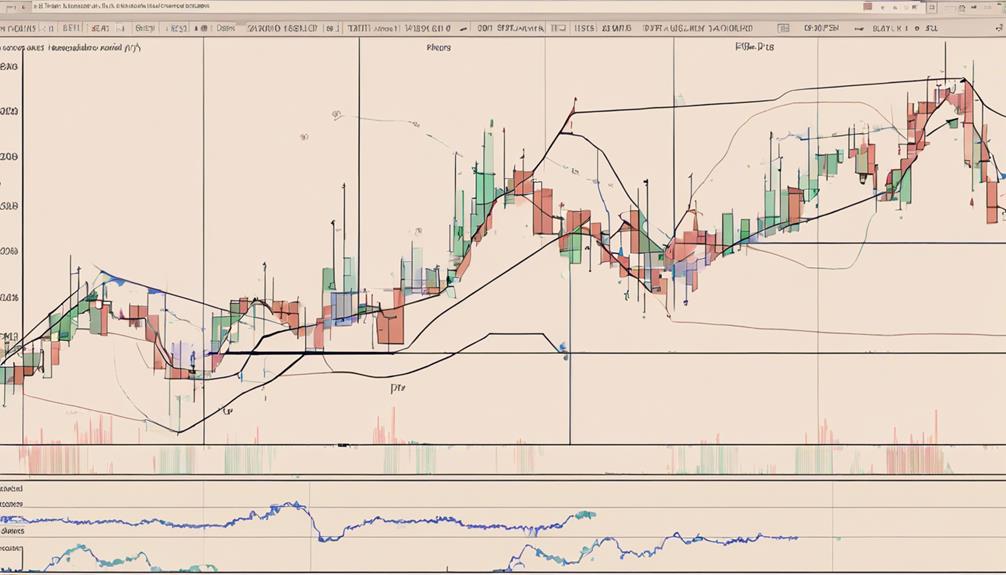
The cloud, a key feature of this trading indicator, is formed by Senkou Span A and Senkou Span B. This cloud isn't just a pretty visual; it represents potential future support and resistance levels.
Traders keen on trend analysis use the cloud's color and position concerning price to gauge trend direction and identify possible entry or exit points.
Understanding how each line contributes to the cloud's formation is crucial for interpreting the Ichimoku Cloud indicator accurately.
Components of Ichimoku Cloud
The components of the Ichimoku Cloud indicator are integral to its functionality and provide valuable insights for traders seeking to analyze market trends effectively.
Components of Ichimoku Cloud:
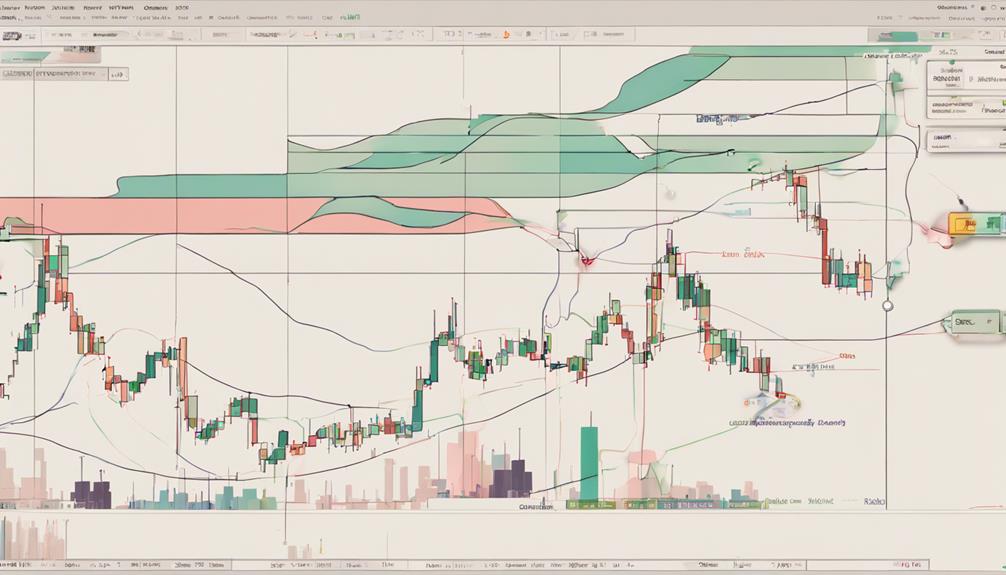
- Tenkan Sen and Kijun Sen: Act as a moving average crossover, with Tenkan Sen calculated over the previous nine time periods and Kijun Sen over the past 26 time periods.
- Senkou Span A and Senkou Span B: Create the Kumo cloud, representing current and historical price action in the market, aiding in trend analysis.
- Trading Decisions: Understanding these components helps identify support and resistance levels, enabling traders to make informed trading decisions based on price action and trend analysis.
Effective Trading Strategies With Ichimoku
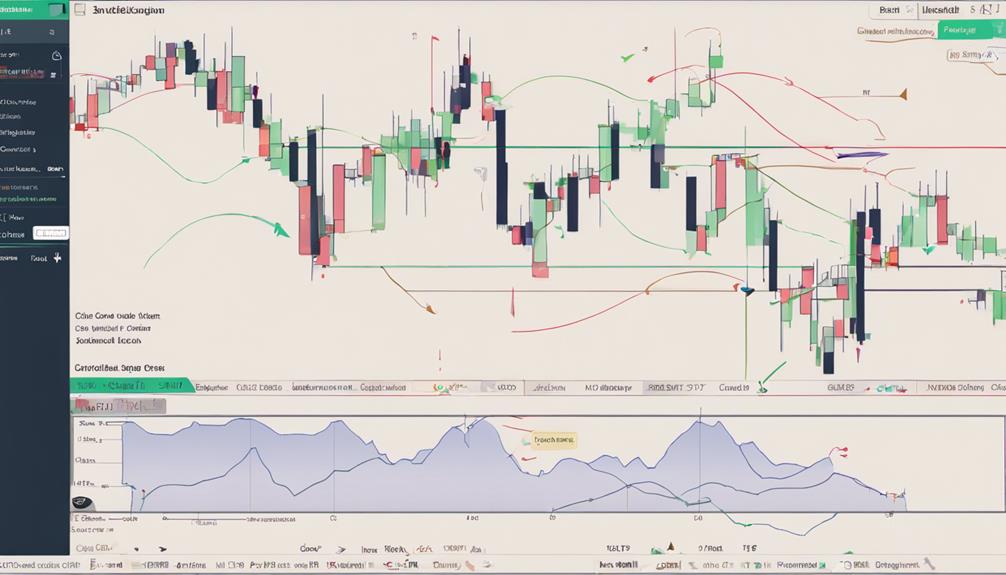
Exploring effective trading strategies with Ichimoku involves leveraging its unique components to generate well-informed entry and exit signals for optimal market analysis. The Ichimoku Cloud works by combining Tenkan-Sen and Kijun-Sen crossovers to signal trade entry and exit points.
Monitoring the Chikou Span line breaking above the cloud confirms strong buy signals within the Ichimoku trading strategy. Determining the best time frame for your trading style is crucial for utilizing Ichimoku effectively.
Additionally, incorporating other technical indicators alongside Ichimoku can enhance your overall trading strategy. Strategies like Cloud breakout and Swing Trading can be implemented by considering factors like Leading Span A crosses for successful trade entries.
Best Practices for Ichimoku Cloud
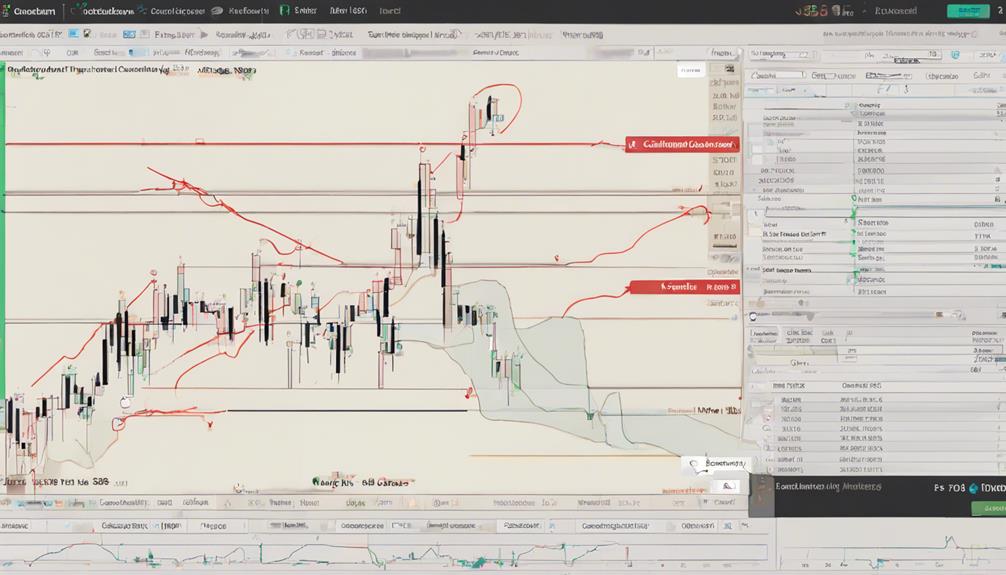
When utilizing the Ichimoku Cloud indicator, consider incorporating cloud thickness to gauge market volatility effectively. Traders use Ichimoku Cloud for technical analysis, drawing support and resistance lines on the chart.
Cloud thickness helps in risk management by indicating market volatility levels. To determine trend direction accurately, traders should pay attention to cloud color and its position in relation to price.
Combining Ichimoku Cloud with other indicators enhances trading precision. By adapting timeframe choices based on your trading style, you can improve the effectiveness of your Ichimoku Cloud strategy.
Improving Trades Using Ichimoku
Incorporating the Ichimoku Cloud indicator into your trading strategy can significantly enhance trade precision by combining five key components for comprehensive trend analysis.
When using the Ichimoku Kinko Hyo indicator, paying attention to the Chikou Span B lines can confirm the trend direction indicated by the cloud, aiding in better entry and exit points.
The Tenkan Sen and Kijun Sen lines are essential in identifying potential trend reversal or continuation points, offering valuable trade signals for buy and sell decisions.
How Can I Use the Ichimoku Cloud Indicator Effectively with Just the 10 Essentials?
When using the Ichimoku Cloud indicator, mastering the 10 essentials can be key to effective trading. By understanding the basics of this powerful tool and incorporating the 10 essentials, traders can leverage the indicator to make informed decisions and analyze market trends with confidence.
Frequently Asked Questions
What Is the Best Way to Use Ichimoku Cloud?
To use Ichimoku Cloud effectively, observe cloud color and position for trend signals. Focus on thickness to gauge market volatility accurately. Execute trades based on cloud movements for better decisions. Combine with other indicators for enhanced accuracy.
Which Indicator Works Best With Ichimoku?
When using Ichimoku, the indicator that works best alongside it is the Moving Average Convergence Divergence (MACD). It complements Ichimoku by confirming trends and providing additional signals for entry and exit points in trading.
What Is the Best Timeframe to Use Ichimoku?
For Ichimoku Cloud, the best timeframe is crucial. Daily works well for medium to long-term trades. Shorter periods like 1-hour are ideal for day trading. Weekly or monthly offer reliable trend signals. Experiment to find your perfect fit!
What Is the Success Rate of the Ichimoku Cloud Indicator?
When using the Ichimoku Cloud indicator, its success rate varies from 55% to 75%. Combining it with other technical indicators increases accuracy. Backtesting helps gauge success in different market conditions. Your experience, risk management, and analysis skills influence its effectiveness.
Conclusion
In conclusion, mastering the Ichimoku Cloud Indicator can significantly enhance your trading skills. By understanding its components and implementing effective strategies, you can make informed decisions and improve your trading outcomes.
Remember, the key to success lies in utilizing this powerful tool strategically and continuously learning from your trades. Stay tuned for more insights and tips on how to maximize the potential of the Ichimoku Cloud Indicator in your trading journey.