
The Parabolic SAR indicator, renowned for its effectiveness in trading, holds a unique position in the toolkit of technical analysis. Its distinctive ability to swiftly adapt to changing market conditions and pinpoint potential trend reversals sets it apart from other indicators.
Traders often find themselves drawn to its intuitive visual signals, but what truly underpins its success? The answer lies in the intricate interplay between its mechanics and the underlying market dynamics. By unraveling the mystery behind the Parabolic SAR's efficacy, traders can unlock new dimensions of market insight and potentially enhance their trading performance.
Key Features of Parabolic SAR
The key features of the Parabolic SAR indicator elucidate its ability to provide precise entry and exit signals in relation to price movements, making it a valuable tool for traders seeking to optimize their trading strategies.
This indicator is particularly adept at identifying trends in the market, aiding traders in capitalizing on strong price movements. By dynamically adjusting its dots based on price fluctuations, Parabolic SAR enables traders to effectively set trailing stop-loss orders, thereby managing risk efficiently.
The simplicity and ease of interpretation of this indicator make it popular among traders of all levels. Additionally, the customization option through the adjustment of the acceleration factor allows for flexibility in adapting to different market conditions.
Mechanics Behind Parabolic SAR
Analyzing the Parabolic SAR indicator involves understanding its underlying mechanics, which revolve around calculating dots based on price direction and acceleration factors to determine trend reversals and assist traders in setting trailing stop-loss orders. The mechanics behind Parabolic SAR can be broken down into key components:
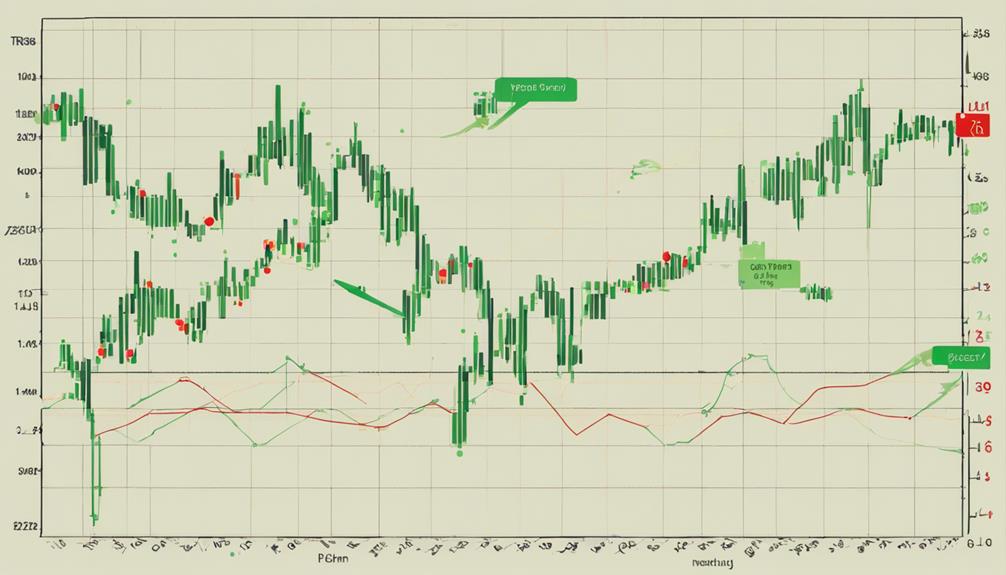
- Calculation of dots: Parabolic SAR calculates dots above or below price candles based on the trend direction.
- Acceleration Factor (AF): The indicator adjusts the AF value, increasing sensitivity to price movements up to a maximum of 0.2.
- Extreme Price (EP): In uptrends, EP represents the highest high, while in downtrends, it signifies the lowest low.
- Trailing stop-loss orders: Traders utilize Parabolic SAR to set dynamic stop-loss orders that follow the trend and capture trend momentum efficiently.
Understanding these mechanics is crucial for traders looking to leverage the Parabolic SAR indicator effectively in their trading strategies.
Signals and Patterns in Parabolic SAR
To assess the effectiveness of the Parabolic SAR indicator, understanding the signals and patterns it generates is essential for traders seeking to make informed decisions in the financial markets.
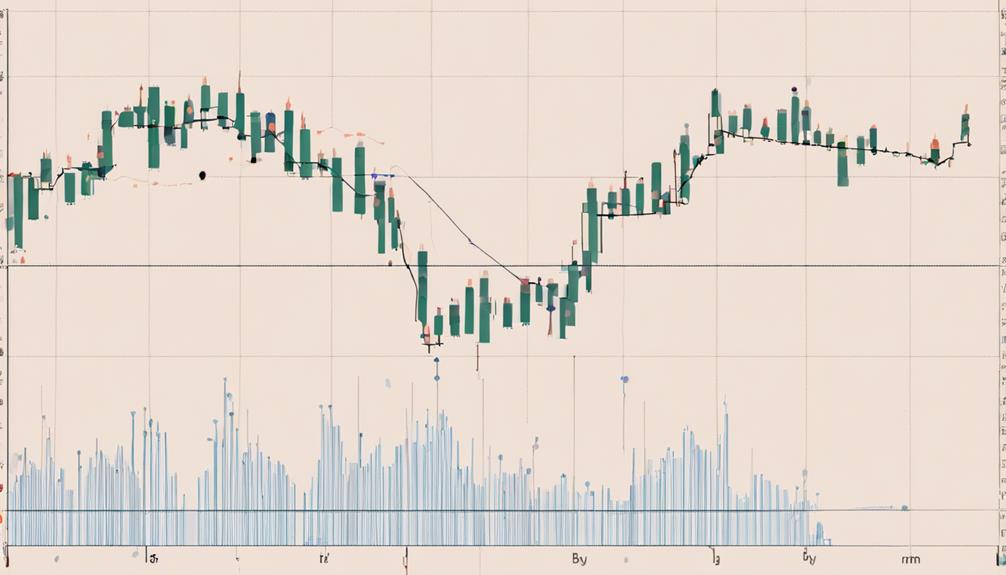
The Parabolic SAR provides buy signals when its dots move below price candles and sell signals when the dots move above the price candles. Additionally, a trend reversal is indicated when three consecutive parabolas appear on the opposite side.
Traders utilize the Parabolic SAR to capture trend momentum by implementing trailing stops based on the indicator's direction. The slope of the parabolic dots serves as a gauge for the strength of the trend, aiding traders in identifying entry and exit points in trending markets.
This indicator is particularly effective in trending markets, as it offers clear signals that enable traders to make informed decisions regarding their positions. By interpreting these signals and patterns, traders can enhance their ability to navigate the markets with confidence and precision.
Trading Confidence With Parabolic SAR
Enhanced trading acumen through utilization of the Parabolic SAR indicator contributes significantly to traders' strategic decision-making processes. When it comes to trading confidence, the Parabolic SAR plays a crucial role in guiding traders through the complexities of the markets. Here are four key ways in which traders can boost their confidence using the Parabolic SAR:
- The indicator provides clear buy and sell signals, helping traders make informed decisions.
- Traders can efficiently set trailing stop-loss orders using the Parabolic SAR, enhancing their risk management strategies.
- Visual cues for trend direction changes offered by the Parabolic SAR help traders navigate market shifts with confidence.
- By capturing trend momentum, traders can use the Parabolic SAR to make well-timed entry and exit decisions, improving overall trading performance.
In trending markets, the simplicity and effectiveness of the Parabolic SAR make it a valuable tool for traders seeking clear trading signals and increased confidence in their trading strategies.
Market Impact of Parabolic SAR
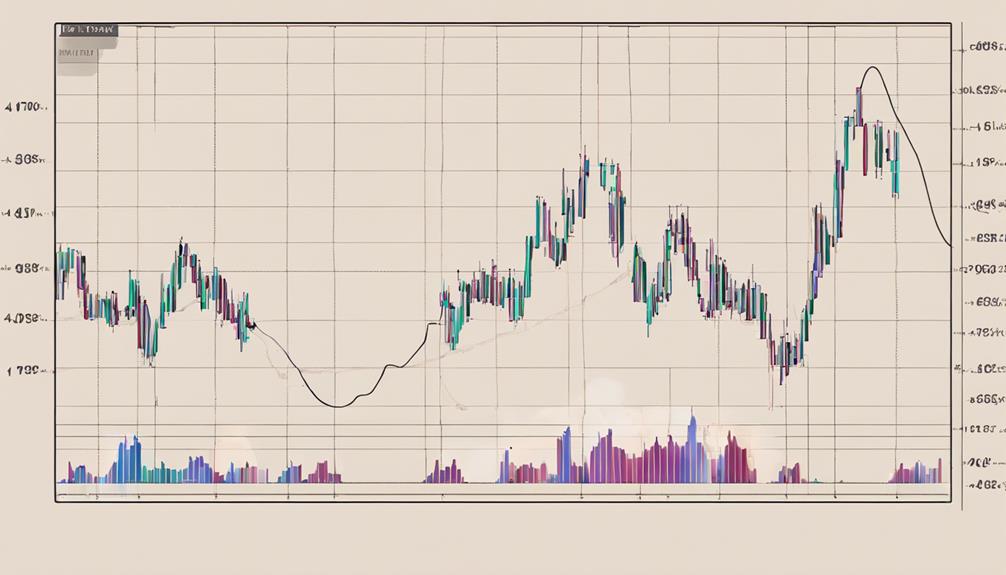
The Market Impact of the Parabolic SAR indicator is significant in guiding traders towards informed decision-making based on trend direction and potential price reversals. Traders rely on the Parabolic SAR to receive timely entry and exit signals in trending markets, enabling them to capitalize on profitable opportunities and mitigate risks effectively.
The indicator's ability to set trailing stop-loss orders aids traders in maximizing profits by securing gains as the price moves in their favor, while also assisting in minimizing potential losses during market downturns. By providing a clear visual representation of trend changes, the Parabolic SAR allows traders to capture significant trend moves with confidence.
Its widespread use among traders of all levels underscores its reputation as an effective tool for managing risk and enhancing trading strategies. Overall, the Parabolic SAR's market impact is undeniable, empowering traders to make well-informed decisions and navigate the dynamic landscape of financial markets with greater precision.
What Specific Features of the Parabolic SAR Indicator Contribute to Its Effectiveness in Trading?
The parabolic SAR indicator trading is effective due to its ability to determine trend direction and potential reversal points. It provides clear signals for entry and exit, helping traders to make informed decisions. Its dynamic nature and responsiveness to price changes contribute to its effectiveness in trading strategies.
Frequently Asked Questions
How Accurate Is the Parabolic SAR Indicator?
The Parabolic SAR indicator demonstrates high accuracy in capturing trends and potential reversals in price movements, especially in trending markets. Its effectiveness lies in providing clear buy and sell signals, aiding traders in strategic decision-making.
What Is the Best Strategy for Parabolic Sar?
The best strategy for Parabolic SAR involves identifying trend reversals with three consecutive parabolas against price movement. Combining it with indicators like ADX and Moving Averages enhances accuracy. Backtesting and continuous evaluation optimize performance.
What Timeframe Is Best for Parabolic Sar?
The best timeframe for utilizing the Parabolic SAR indicator varies depending on the trader's objectives and risk tolerance. Shorter timeframes like 15-minute charts cater to day traders seeking quick signals, while longer timeframes such as daily charts offer more reliable trend confirmation.
How Does a Parabolic Indicator Work?
The Parabolic SAR indicator tracks price trends by plotting dots above or below the price based on momentum shifts. Dots above signal a bearish trend; below, a bullish trend. Traders utilize it for setting stop-loss orders and spotting trend reversals.
Conclusion
In conclusion, the Parabolic SAR indicator's effectiveness lies in its ability to provide clear signals for traders to make informed decisions. Despite its popularity and widespread use, the indicator's simplicity can sometimes lead to oversights and misinterpretations in volatile markets.
While it remains a valuable tool for risk management and trend identification, traders should exercise caution and supplement their analysis with additional indicators to enhance their trading strategies.