
Explore how the Aroon indicator's trading effectiveness transcends traditional methods by providing timely trend insights and potential reversal signals. Uncover the nuances of this tool to refine your trading approach and stay ahead of market shifts.
Discover how the Aroon indicator's strategic application can elevate your trading game and potentially enhance your portfolio performance. Unlock the secrets behind this indicator's prowess and learn how to leverage its strengths while mitigating its weaknesses to optimize your trading decisions.
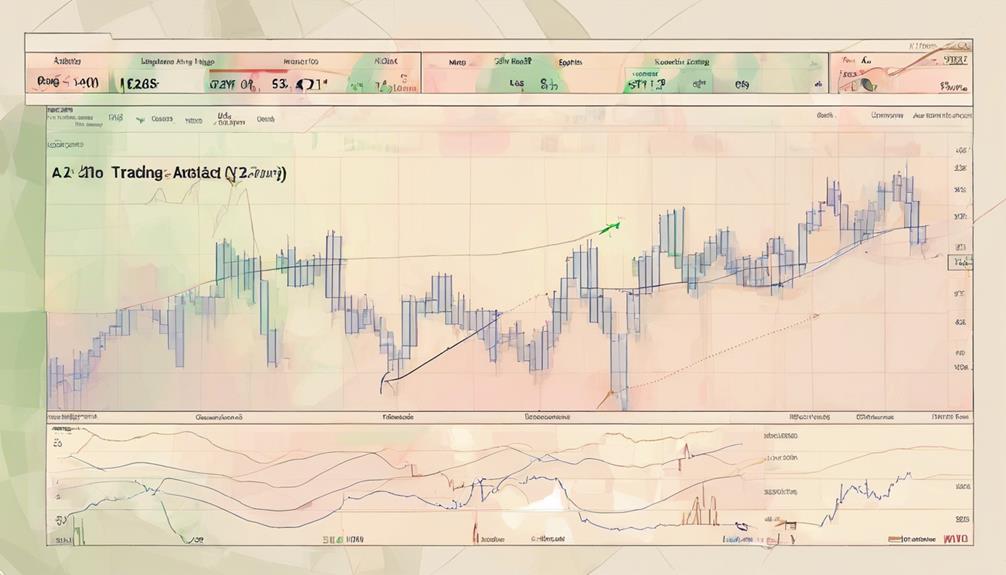
Aroon Indicator Overview
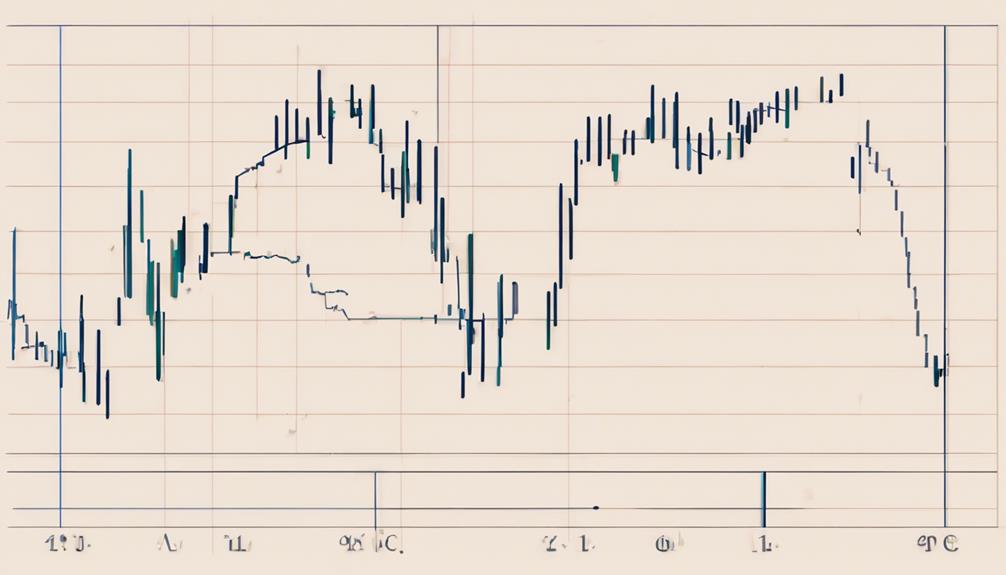
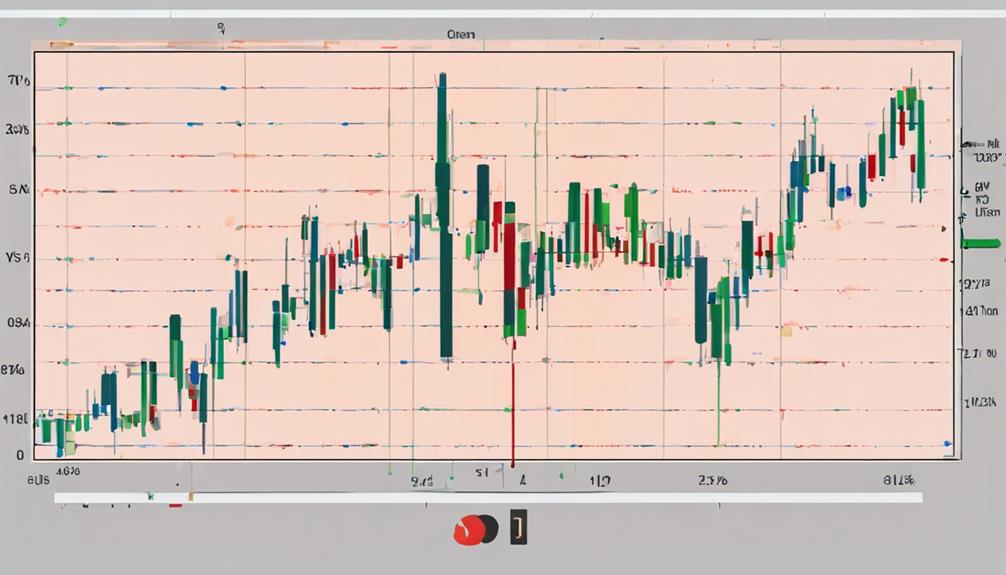
When analyzing market trends, the Aroon Indicator, developed by Tushar Chande in 1995, serves as a valuable tool for measuring trend strength and potential reversals. This indicator consists of two lines, Aroon Up and Aroon Down, which help traders identify uptrends and downtrends.
Aroon Up indicates the strength of an uptrend, while Aroon Down shows the strength of a downtrend, aiding in spotting potential trend reversals. By incorporating these lines into trading strategies, traders can make more informed decisions based on trend duration and intensity.
The Aroon Indicator is renowned for its effectiveness in spotting buy and sell signals, making it one of the best tools for traders looking to capitalize on market trends and optimize their trading strategies.
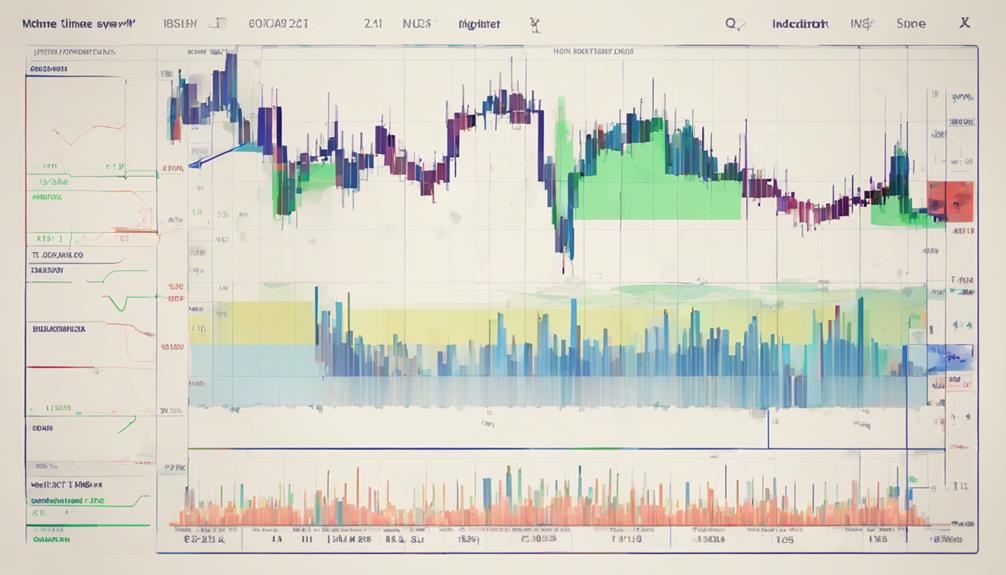
Aroon Indicator Calculation
To calculate the Aroon Indicator, you need to utilize specific formulas for Aroon-Up and Aroon-Down, which involve determining the number of periods since the highest high and lowest low, respectively, within the set period.
The Aroon-Up calculation is [(Number of periods) – (Number of periods since the High)] / (Number of periods) * 100%, while the Aroon-Down calculation is [(Number of periods) – (Number of periods since the Low)] / (Number of periods) * 100%.
The default period setting for Aroon Indicator is 14, suitable for short-term trend analysis. For analyzing long-term trends, longer periods (25-30) are recommended.
Customizable colors and adjustable overbought/oversold levels play a crucial role in interpreting Aroon Indicator signals for trend analysis.
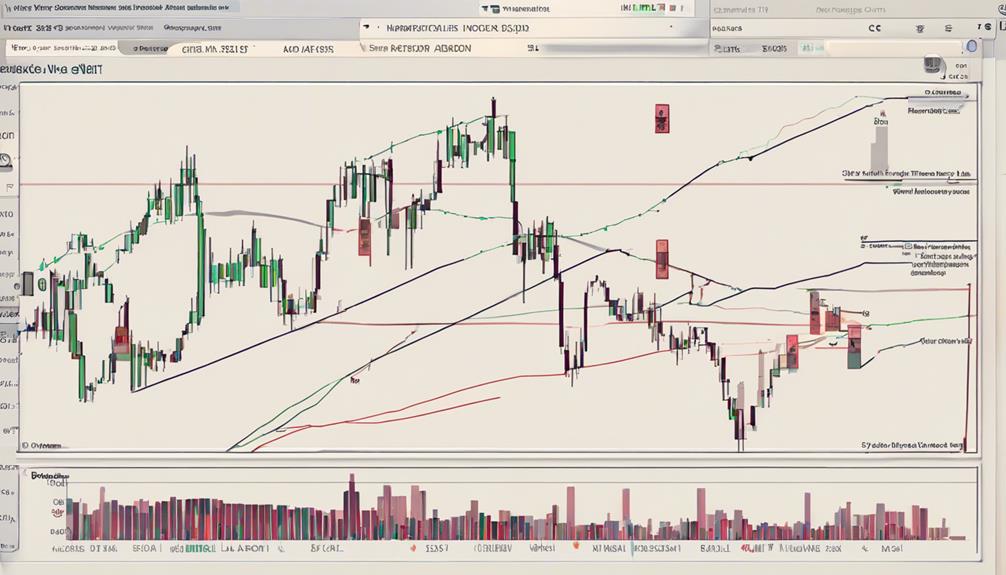
Aroon Indicator Interpretation
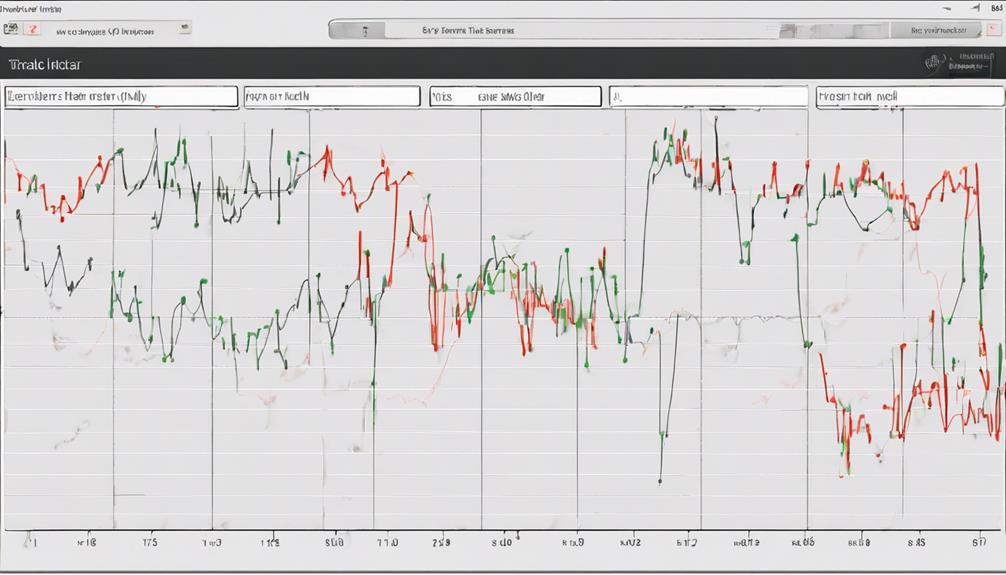
The Aroon Indicator Interpretation involves analyzing the trend strength through the Aroon-Up and Aroon-Down lines, providing valuable insights for traders. When interpreting the Aroon Indicator, traders can utilize various strategies to navigate the market effectively.
Here are some key points to consider:
- Aroon-Up and Aroon-Down lines crossing can signal potential trade opportunities.
- High Aroon-Up values indicate bullish market strength, while high Aroon-Down values suggest bearish market strength.
- Combining Aroon Indicator signals with other technical indicators can enhance trading decisions.
- Customizable settings allow traders to adapt the indicator to different market conditions efficiently.
Understanding these aspects can help traders make informed decisions when employing the Aroon indicator in their trading strategies.
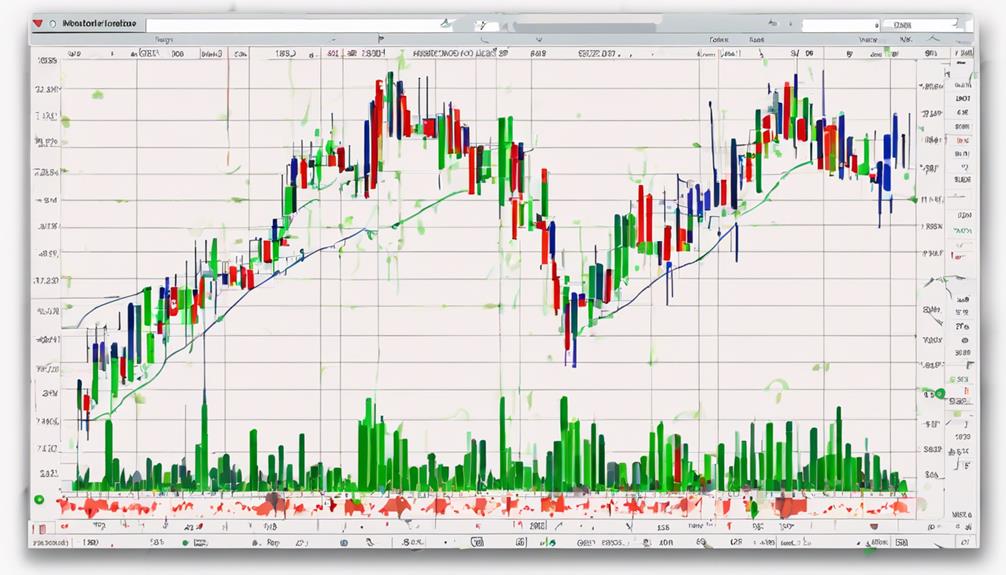
Aroon Indicator Backtesting Results
Analyzing the backtesting results of the Aroon Indicator reveals varying levels of effectiveness across different settings and timeframes in trading scenarios.
In the Aroon-25 setting tested on 5-minute OHLC charts, a 47% win rate was observed, indicating some profitability potential.
However, the indicator underperformed on other timeframes, suggesting the importance of specific configurations for its success.
Notably, the Aroon Indicator didn't exhibit effectiveness for day trading due to low success rates in the backtesting results.
The data highlights the significance of choosing appropriate settings and timeframes when utilizing the Aroon Indicator to maximize its effectiveness and improve trading outcomes.
Aroon Indicator Trading Strategies
How can Aroon Indicator trading strategies be effectively implemented to capitalize on market trends and potential breakouts? Here are some key strategies to consider:
- Aroon Breakout Strategy: Look for buy signals when Aroon-Up is rising and Aroon-Down is falling, signaling potential breakouts.
- Aroon Trend Strength Strategy: Identify strong bullish trends when Aroon-Up nears 100 and strong bearish trends when Aroon-Down approaches 100.
- Aroon Breakout Trading Strategy: Anticipate breakouts by using Aroon signals to enter trades early before price breakouts occur.
- Aroon Oscillator Trading Strategy: Utilize the Aroon Indicator's features for breakout, trend strength, and pullback strategies.
Aroon Indicator Combining With Other Indicators
When combining the Aroon Indicator with other indicators, you can enhance trend confirmation and identify potential trend reversals for more comprehensive trend and momentum analysis.
Pairing the Aroon indicator with the Relative Strength Index (RSI) can provide enhanced trend confirmation.
Combining Aroon with Bollinger Bands helps in pinpointing potential trend reversals.
Utilizing the Aroon Indicator alongside the Moving Average Convergence Divergence (MACD) offers a more comprehensive analysis of trends and momentum.
Additionally, when paired with the Average Directional Index (ADX), the Aroon Indicator can provide a stronger assessment of trend strength and direction.
This strategic combination of indicators can significantly improve your understanding of market trends and enhance your trading decisions.
Aroon Indicator Buy and Sell Signals
Combining the Aroon Indicator with other indicators enhances trend confirmation and helps in identifying potential trend reversals for a more comprehensive analysis of market trends and momentum. When utilizing the Aroon Indicator, buy signals are triggered by the Aroon-Up crossing above the Aroon-Down, signifying potential entry points. Conversely, sell signals are generated when the Aroon-Down crosses above the Aroon-Up, indicating possible trend direction changes. The Aroon Indicator's signals are rooted in assessing trend strength and duration, empowering traders in strategic decision-making. Additionally, Aroon crossovers offer valuable insights for capitalizing on market trends effectively.
- Buy signals: Aroon-Up crossing above Aroon-Down
- Sell signals: Aroon-Down crossing above Aroon-Up
- Identifying potential entry points for trades
- Assessing trend strength and duration for strategic decision-making
Aroon Indicator Accuracy Evaluation
An evaluation of the Aroon Indicator's accuracy reveals key insights into its performance and profitability under specific configurations. Backtesting the Aroon Indicator with a 25 setting on 5-minute OHLC charts displays a 47% win rate, indicating its effectiveness under certain conditions.
It's essential to note that the Aroon Indicator's profitability is closely tied to utilizing specific configurations, which can significantly impact its success rates. However, the indicator demonstrates limitations on various timeframes, making it less suitable for day trading due to its lower success rates.
Testing the Aroon Indicator is crucial to assess its profitability accurately, as it's prone to generating false signals that can affect trading outcomes significantly.
Aroon Indicator Limitations
Considering the Aroon Indicator's susceptibility to false signals and limited analysis scope, it's crucial to understand its inherent limitations for effective trading strategies.
- The Aroon Indicator may result in false signals, potentially leading to losses in trading.
- It lacks consideration for volume and support/resistance levels, limiting its comprehensive analysis capabilities.
- Backtesting results reveal varying success rates on different timeframes, affecting its overall effectiveness.
- It's observed to be less effective for day trading, with lower success rates reported.
Aroon Indicator Summary
When utilizing the Aroon Indicator, traders can effectively gauge trend strength and identify potential reversals through the analysis of its two key components, Aroon Up and Aroon Down lines.
Developed by Tushar Chande in 1995, this indicator helps in trend identification by showcasing the strength of uptrends and downtrends. It assists traders in spotting entry and exit points by observing line crossovers and trend directions.
Despite its benefits, the Aroon Indicator may generate false signals and overlook essential factors like volume and support/resistance levels. By understanding the Aroon Up and Aroon Down lines, traders can enhance their ability to interpret market trends and make informed trading decisions based on the indicator's insights.
How Effective are the Aroon Indicator Strategies for Day Trading, According to Insights?
Many traders find day trading with Aroon indicator to be an effective strategy. The Aroon indicator helps identify trend changes and potential entry and exit points, making it a valuable tool for day traders. By incorporating Aroon indicator strategies into their trading practices, traders can make more informed decisions and improve their overall performance.
Frequently Asked Questions
What Is the Success Rate of the Aroon Indicator?
The Aroon indicator's success rate varies based on settings and timeframes. To optimize its potential, customize configurations. In day trading, it often shows lower success rates on different timeframes. Tailored settings can enhance its effectiveness.
What Is the Most Successful Trading Indicator?
When choosing a successful trading indicator, consider the Moving Average Convergence Divergence (MACD). It effectively shows momentum shifts, offers clear buy/sell signals, and is popular among traders. Combining it with other indicators can enhance trading strategies.
What Is the Best Strategy for Aroon?
Utilize the Breakout Trading Strategy with Aroon for identifying new trends and breakouts. Interpret Aroon-Up near 100 as a strong bullish trend. Anticipate breakouts with Aroon signals. Aroon's effectiveness lies in detecting trend changes and providing profitable buy and sell signals.
Is Aroon a Leading Indicator?
Yes, Aroon is a leading indicator. It gauges trend strength and predicts reversals early. By monitoring Aroon lines' movements, you can foresee market shifts. Its proactive nature empowers you to exploit emerging trends and secure advantageous positions.
Conclusion
In conclusion, the Aroon indicator offers valuable insights into trend strength and potential reversals, making it a powerful tool for traders. By backtesting and optimizing configurations, you can enhance its effectiveness in your trading strategies.
Despite its limitations, such as false signals and overlooking key factors like volume and support/resistance levels, the Aroon indicator remains a key component in technical analysis. Keep honing your skills and adapting to market changes to stay ahead of the curve.