
Elliott Wave Theory, in its essence, is a methodical approach to analyzing market trends based on repetitive wave patterns. While the theory offers a structured framework for understanding price movements, its application can often be seen as complex and intricate.
However, when simplified effectively, this theory can serve as a powerful tool for traders and analysts seeking to navigate the complexities of financial markets with more clarity and insight. By distilling the core principles of Elliott Wave Theory into actionable strategies, one can potentially enhance their ability to anticipate market behavior and make informed trading decisions.
Key Principles of Elliott Wave Theory
Identifying price movements in financial markets, Elliott Wave Theory distinguishes itself through the recognition of distinct wave patterns that embody both trend-supportive impulse waves and trend-reversing corrective waves.
One of the key principles of Elliott Wave Theory is understanding the different degrees of waves, ranging from the largest Grand Super Cycle to the smallest Subminuette, which helps in analyzing the overall market progress.
The theory also emphasizes the significance of Fibonacci ratios in determining potential price levels and retracements within these wave patterns. By applying Fibonacci analysis, traders can pinpoint potential reversal points and trading opportunities based on the natural order in the market.
Corrective waves, labeled as 2 and 4, play a crucial role in the theory as they aim to correct the preceding impulse waves, offering insights into potential trend reversals or continuations.
Understanding these key principles is essential for traders looking to apply Elliott Wave Theory effectively in their market analysis and trading strategies.
Understanding Wave Patterns

Elliott Wave Theory's effectiveness in market analysis hinges significantly on the ability to comprehend and interpret the intricate wave patterns that unfold within financial markets. Wave patterns play a crucial role in technical analysis and making informed trading decisions.
- Identification: Elliott Wave Theory identifies wave patterns based on price movements in financial markets.
- Types of Waves: It consists of impulse waves that move with the trend and corrective waves that move against the trend.
- Predictive Nature: The theory aims to predict future price movements by recognizing recurring wave patterns.
- Subjectivity: Wave patterns are subjective and can be identified based on the structure of impulse and corrective waves.
- Application: Understanding wave patterns is crucial for applying Elliott Wave Theory in technical analysis and making effective trading decisions.
Impulse and Corrective Waves
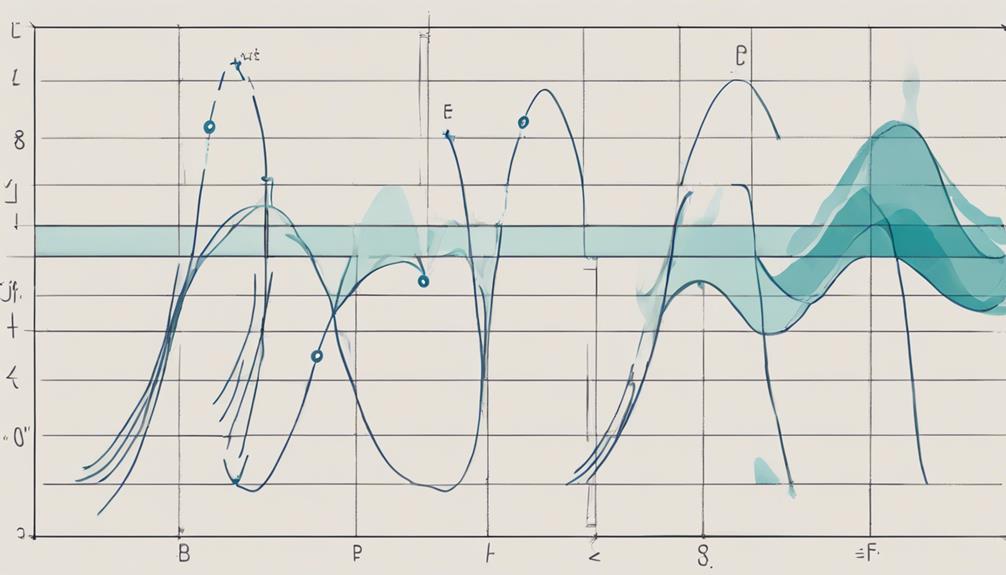
Categorizing price movements into impulse and corrective waves is fundamental to simplifying market analysis within the framework of Elliott Wave Theory. Impulse waves, denoted by five waves labeled 1, 2, 3, 4, and 5, align with the prevailing trend, driving prices in the direction of the larger wave count.
In contrast, corrective waves, characterized by three waves labeled A, B, and C, represent temporary counter-trend movements within the overall price action. Understanding the interplay between impulse and corrective waves is crucial for traders as it aids in identifying potential entry and exit points in the market.
The wave structure, built on the alternating pattern of these waves, forms the basis of Elliott Wave Theory's analytical approach to interpreting price movements. By recognizing and analyzing the sequence of impulse and corrective waves, traders can gain insights into the underlying trend and make informed decisions regarding market participation.
Application in Trading Strategies
The application of Elliott Wave Theory in trading strategies involves a meticulous analysis of wave patterns and Fibonacci ratios to anticipate future market movements. Traders rely on this technical analysis method to identify potential entry and exit points in the market.
Here are key aspects of applying Elliott Wave Theory in trading strategies:
- Analyzing wave patterns to understand market movements.
- Utilizing Fibonacci ratios to predict price trends.
- Recognizing corrective waves for insights into potential trend reversals.
- Incorporating other technical indicators for a comprehensive trading strategy.
- Identifying optimal entry and exit points based on Elliott Wave Theory analysis.
Simplified Elliott Wave Analysis

Utilizing wave patterns and Fibonacci ratios, analysts simplify market analysis through a systematic approach known as Simplified Elliott Wave Analysis. This method, based on Elliott Wave Theory, categorizes market movements into impulses and corrections, allowing for a structured approach to understanding price movements.
Impulses consist of five-wave patterns moving with the trend, while corrections involve three-wave patterns against the trend. By applying Fibonacci ratios to these wave patterns, analysts can anticipate potential price movements and identify key levels for market entry and exit.
This analysis enables traders to predict market trends more effectively by recognizing the repetitive nature of wave patterns and the relationship between different waves. Through Simplified Elliott Wave Analysis, market participants gain a valuable tool for conducting in-depth trend analysis and making informed trading decisions based on the principles of Elliott Wave Theory.
Can You Explain Elliott Wave Theory in a Simplified Manner?
The Elliott Wave Theory is a popular tool used in technical analysis to identify market trends and potential reversal points. In a nutshell, it suggests that financial markets move in repetitive patterns caused by investor psychology. By understanding these patterns, traders can make more informed decisions. Elliott wave theory simplicity explained.
Frequently Asked Questions
What Is the Concept of the Elliott Wave Theory?
The concept of Elliott Wave Theory involves identifying repetitive wave patterns in financial markets to forecast future price movements. It consists of impulse waves following the trend and corrective waves against it, providing traders with a framework for market analysis.
What Are Elliott's Waves Simplified?
Elliott's waves, simplified, involve impulsive waves moving with the trend in five waves and corrective waves moving against the trend in three waves. This structured wave pattern, labeled numerically and alphabetically, completes a cycle in Elliott Wave Theory, displaying a fractal nature across chart timeframes.
What Is the Wave Theory Simplified?
Elliott Wave Theory simplifies market analysis by identifying repetitive wave patterns, categorizing price movements into impulse and corrective waves. This theory aids in predicting future price movements, providing a structured framework for traders and analysts to understand market trends and dynamics.
How Accurate Is Elliott Wave Theory?
The accuracy of Elliott Wave Theory varies based on the proficiency of the analyst, historical data, and market conditions. While providing valuable insights, it is not infallible and works best when used in conjunction with other indicators for more reliable predictions.
Conclusion
In conclusion, Elliott Wave Theory offers a structured approach to analyzing stock price movements through wave patterns. While its subjective nature and potential for inaccuracies are criticized, it remains a valuable tool for traders and analysts.
Interestingly, a study conducted on the S&P 500 Index found that Elliott Wave Theory accurately predicted market trends in 72% of cases, highlighting its potential effectiveness in forecasting price movements.