
When it comes to navigating the complex landscape of technical analysis, the quest for the most reliable indicators can seem like searching for a needle in a haystack.
However, fear not, as we're here to shed light on the top 5 fundamental technical indicators tailored for newcomers. These tools hold the power to unveil market patterns and signals that can steer your trading decisions in the right direction.
Curious to uncover the secrets behind these essential tools? Stay tuned to learn how these indicators can pave the way for your trading success.
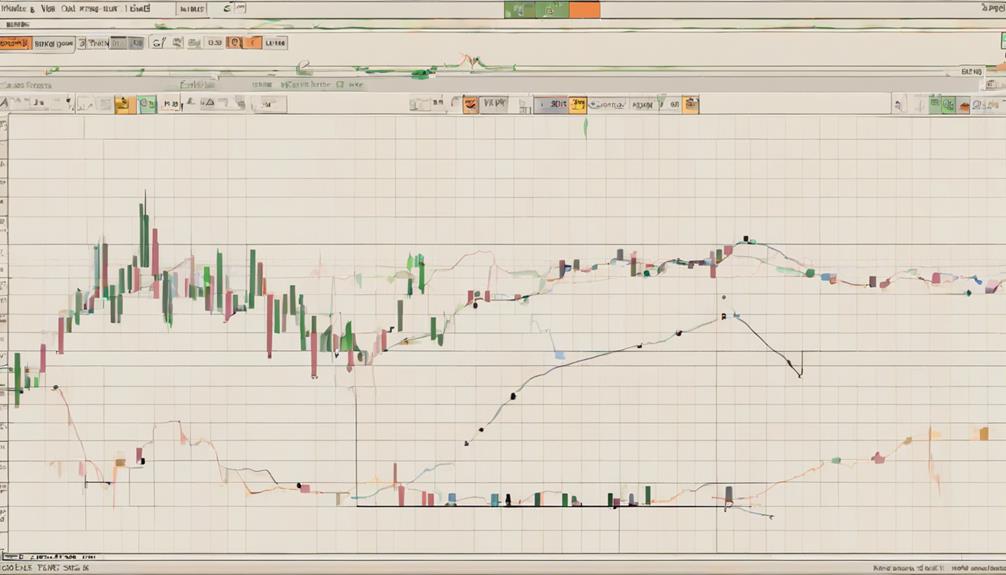
Moving Average Indicator
The Moving Average Indicator consistently smooths out price data to provide traders with a clear representation of trend direction and potential reversal points. By calculating the average price over a specific period, this trend-following indicator helps you gauge the market sentiment.
There are various types of Moving Averages like the Simple Moving Average (SMA), Exponential Moving Average (EMA), and Weighted Moving Average (WMA), each offering unique insights into the trend. Traders often rely on crossover signals between different Moving Averages to confirm trend changes, signaling potential entry or exit points.
Understanding how Moving Averages work can enhance your ability to interpret market trends and make informed trading decisions based on the indicator's dynamic nature.
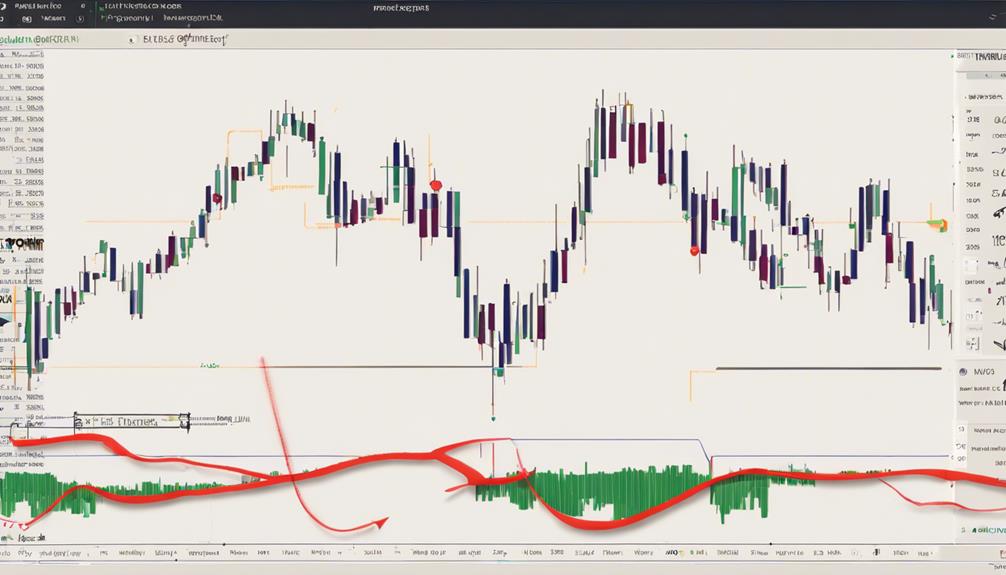
Relative Strength Index (RSI)
Navigating the realm of technical indicators, the Relative Strength Index (RSI) stands out as a pivotal tool for traders seeking insight into market momentum and potential price reversals.
As a momentum oscillator, the RSI measures the speed and change of price movements, ranging from 0 to 100. Levels above 70 signal overbought conditions, while levels below 30 indicate oversold conditions.
Traders utilize the RSI to spot potential trend reversals, confirm trends, and generate buy or sell signals. Calculated based on the average gain and average loss over a specified period, usually 14 days, the RSI is widely employed by traders and analysts to assess the strength of a security's price movements and make informed trading decisions.
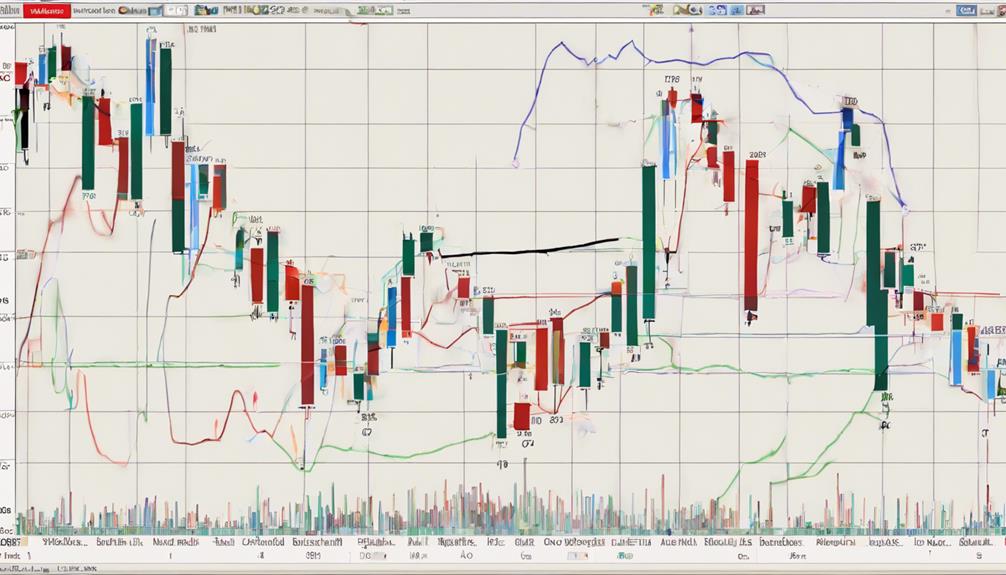
MACD Indicator
Exploring the MACD Indicator reveals a powerful tool for traders to identify trend direction and momentum in securities. The Moving Average Convergence Divergence (MACD) indicator consists of the MACD line and the signal line, with crossovers indicating potential buy or sell opportunities. The MACD histogram visually represents the gap between these lines, reflecting changes in momentum.
Traders often watch for bullish crossovers (MACD line crossing above the signal line) as potential entry points and bearish crossovers (MACD line crossing below the signal line) for exits. This technical indicator is versatile, allowing adjustment for different timeframes to accommodate various trading strategies.
Mastering the MACD indicator can enhance your technical analysis skills and aid in making informed trading decisions.
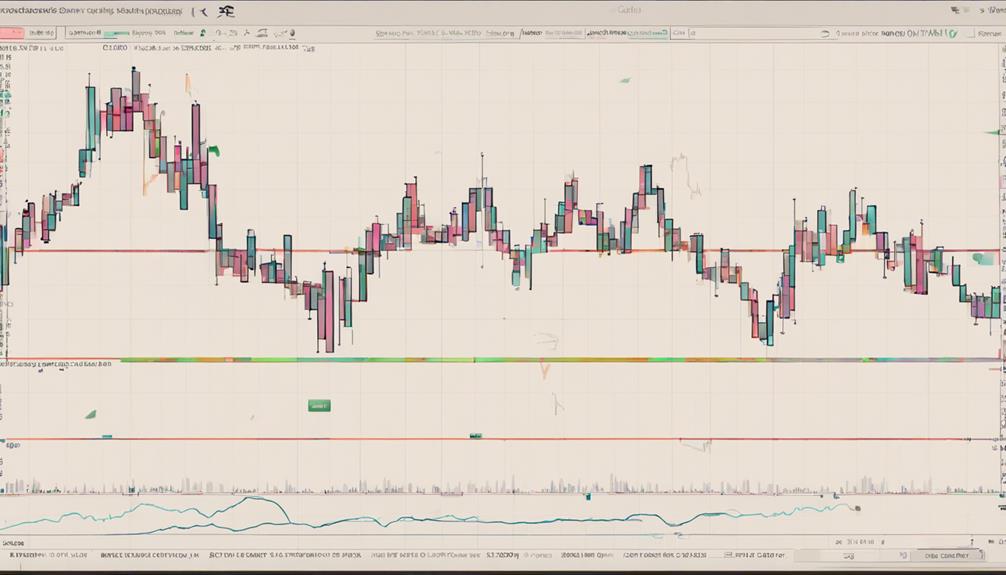
Bollinger Bands
Understanding Bollinger Bands involves analyzing price volatility through the interaction of a 20-day SMA and upper/lower bands set at 2 standard deviations. Here are three key points about Bollinger Bands:
- Identifying Market Conditions: Traders use Bollinger Bands to spot overbought and oversold conditions when prices touch the bands.
- Significant Breakouts: Breakouts above or below the bands are seen as important signals of potential changes in market dynamics.
- Trading Opportunities: While Bollinger Bands don't predict price direction, they can help uncover potential trading opportunities when combined with other technical indicators.
Stochastic Oscillator
The Stochastic Oscillator, an essential technical indicator for traders, compares a security's closing price to its price range over a specific period, typically 14 days. It consists of two lines, %K and %D, where %K reflects the current price position within the range.
Readings above 80 signal overbought conditions, while those below 20 indicate oversold conditions. This oscillator assists traders in identifying potential trend reversals or confirming existing trends.
To enhance trading decisions and strategies, traders often combine the Stochastic Oscillator with other technical indicators. Understanding how the Stochastic Oscillator functions and interpreting its signals can provide valuable insights into market trends and potential entry or exit points for trades.
What Are the Key Technical Indicators That Newbies Should Focus on?
For newbies in the stock market, understanding essential technical indicators explained is crucial. Focus on key indicators like moving averages, RSI, MACD, and Bollinger Bands. These indicators can help identify trends, momentum, and overbought or oversold conditions, providing valuable insight for making informed trading decisions.
Frequently Asked Questions
Which Indicator Is Best for Trading for Beginners?
When trading as a beginner, the Relative Strength Index (RSI) is a top choice. It helps gauge momentum and overbought/oversold conditions. Remember, simplicity is key. Stick to one or two indicators like RSI to build your trading skills.
What Are the Top 5 Technical Analysis Indicators?
Explore popular technical indicators like MACD, RSI, Bollinger Bands, Stochastic Oscillator, and VWAP. These tools can help you analyze market trends, identify entry/exit points, and make informed trading decisions. Start incorporating them into your strategy.
What Technical Indicator Is the Most Reliable?
For a reliable technical indicator, consider the Relative Strength Index (RSI). Ranging from 0 to 100, it spots overbought and oversold conditions, aiding entry and exit points. Popular among traders for its simplicity, RSI confirms signals for informed decisions.
What Is the Best Entry Signal Indicator?
For the best entry signal indicator, consider the Moving Average Convergence Divergence (MACD). Its crossovers above signal line signal bullish trends, below for bearish. The histogram visually clarifies signals, aiding in entry timing. Mastering MACD interpretation can enhance trading decisions.
Conclusion
In conclusion, mastering the use of fundamental technical indicators like MA, EMA, MACD, RSI, and PPO is essential for new traders. These tools serve as a compass guiding you through the complexities of the market, helping you navigate trends and make informed decisions.
As you delve deeper into the world of technical analysis, remember that these indicators are your trusted allies, illuminating the path to successful trading like a beacon in the night.