
In the realm of technical analysis, pivot points serve as a fundamental tool for traders seeking to navigate the complexities of financial markets with precision.
As market participants strive to decipher trends and identify potential entry and exit points, pivot points offer a structured framework that can unveil hidden opportunities.
By understanding the nuances of pivot point calculations and effectively interpreting their implications, traders can harness these indicators to enhance their strategic decision-making process.
The exploration of pivot points in this guide promises to shed light on their practical applications and strategic relevance, providing traders with a foundation for informed and data-driven trading practices.
Understanding Pivot Point Calculations
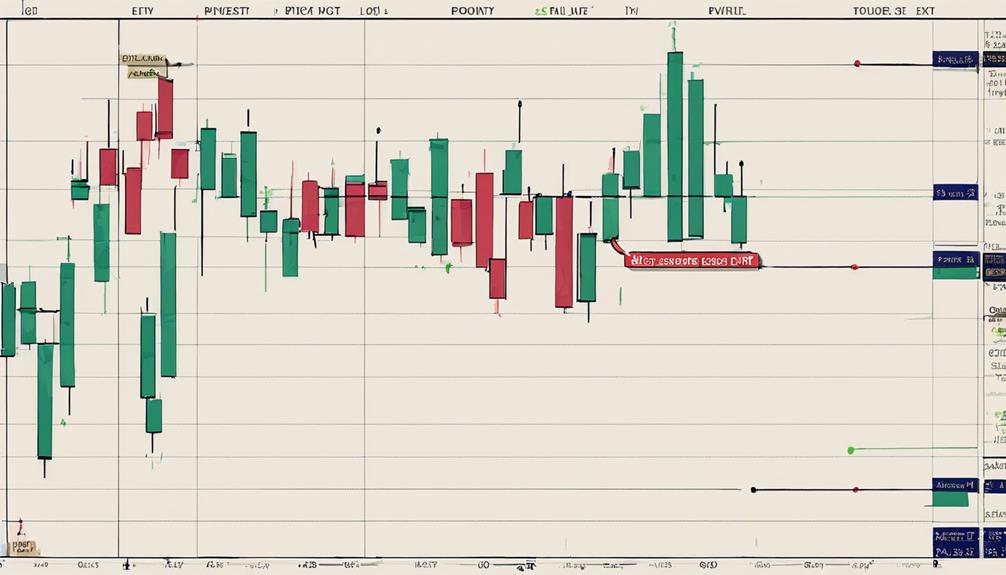
Analyzing market trends with pivot points necessitates a comprehensive understanding of the precise calculations involved. Pivot points are derived from the previous day's high, low, and close prices.
The main pivot point (PP) is calculated as the average of these three prices. Support and resistance levels, such as S1, S2, S3, R1, R2, and R3, are then determined using the pivot point and the previous day's price data.
These levels act as crucial reference points for traders, indicating potential areas of price movement and trend direction.
Interpreting Pivot Point Levels
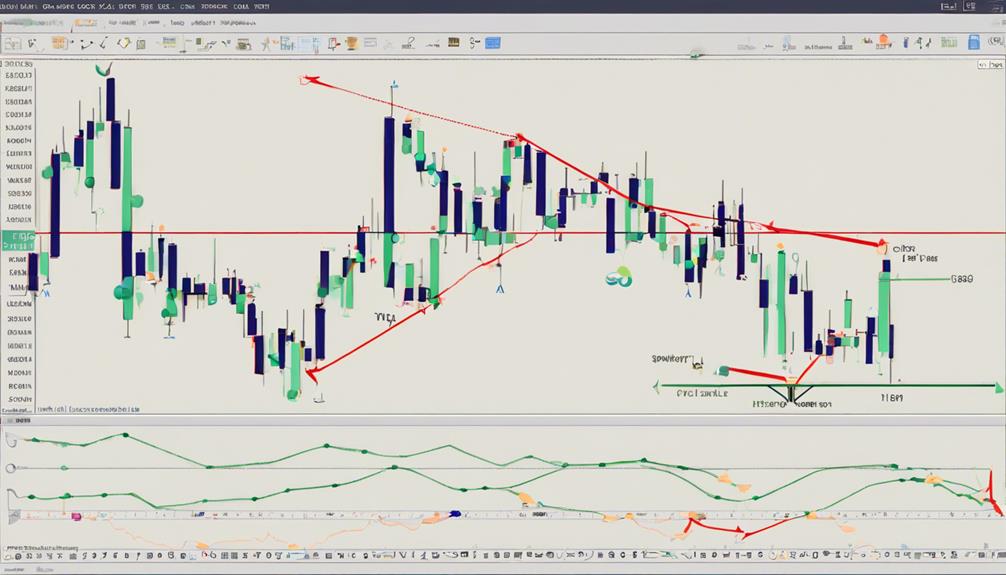
Interpreting pivot point levels involves analyzing key price barriers derived from the previous day's high, low, and close prices to guide traders in making strategic decisions regarding market entry and exit points. When interpreting pivot point levels, traders consider various factors to gauge potential price movements effectively:
- Support and Resistance Levels: Pivot points provide traders with essential support and resistance levels that can help identify potential reversals or continuations in price trends.
- Price Action Breaks: Observing how the price behaves around pivot point levels can signal potential breakout opportunities or trend reversals.
- Entry and Exit Points: Traders use pivot point levels to determine optimal points to enter or exit trades, aligning their strategies with these key price levels.
- Pivot Point Trading: Pivot point levels serve as a cornerstone for pivot point trading strategies, helping traders establish clear trading plans based on these levels.
- Price Movement: Understanding the relationship between price movement and pivot point levels is crucial for interpreting market sentiment and making informed trading decisions.
Advantages of Using Pivot Points
Pivot points offer traders a systematic approach to identifying key levels in the market that can aid in strategic decision-making for trade entries and exits. By utilizing pivot points, traders can pinpoint crucial support and resistance levels, which are instrumental in setting effective entry and exit points for their trades. These levels derived from pivot points also play a vital role in predicting potential price reversals and establishing profit targets.
One of the significant advantages of pivot points is their versatility across different timeframes, providing traders with flexibility in developing and implementing various trading strategies. Moreover, when combined with other technical indicators, such as moving averages or oscillators, pivot points can enhance traders' analytical capabilities and decision-making processes, leading to more informed and potentially profitable trading decisions.
Common Mistakes to Avoid With Pivot Points

When incorporating pivot points into trading strategies, it is critical to avoid several common mistakes that can hinder accurate decision-making and trading outcomes.
- Avoid using pivot points in isolation; always combine them with other technical indicators for better accuracy in trading decisions.
- Do not rely solely on pivot points for predicting price movements; consider them as part of a comprehensive trading plan.
- Avoid using outdated or incorrect pivot point calculations, as this can lead to inaccurate support and resistance levels.
- Be cautious of over-trading based solely on pivot points; consider market conditions and overall trend analysis for better decision-making.
- Avoid ignoring the importance of adapting pivot points to different timeframes and market conditions for more effective trading strategies.
Developing a Pivot Point Trading Strategy
How can traders effectively incorporate pivot points into their trading strategies to optimize decision-making and trading outcomes?
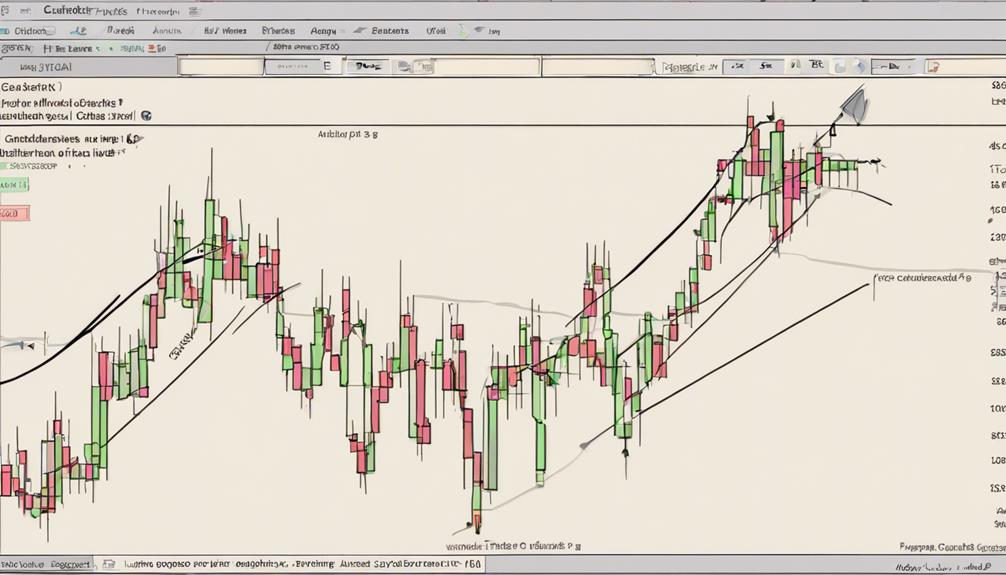
Pivot points, derived from the previous day's high, low, and close prices, offer crucial support and resistance levels that guide trading decisions. When developing a pivot point trading strategy, traders often look for opportunities to enter and exit trades based on price behavior around these key levels.
One common approach is the pivot point breakout strategy, where traders enter positions when prices breach a pivot level, supported by confirmation from other indicators. This method aims to capitalize on potential price momentum following the breakout.
Successful implementation of pivot point strategies involves considering various timeframes, allowing for flexibility in trading styles from intraday to longer-term trades. To enhance the effectiveness of pivot points in trading, it is essential to combine them with other technical analysis tools to make well-informed and strategic decisions, maximizing the potential for profitable outcomes.
How Can I Use Pivot Points as a Technical Indicator in Trading?
Pivot points have been used by traders for years as a comprehensive pivot points indicator. By using these key levels, traders can identify potential support and resistance levels, as well as trend reversals. Pivot points can be used in various timeframes to make informed trading decisions based on price action.
Frequently Asked Questions
What Indicator Works Best With Pivot Points?
When considering what indicator works best with pivot points, it is crucial to analyze various indicators like MACD, RSI, Bollinger Bands, Fibonacci retracement levels, and Ichimoku Cloud. Each indicator complements pivot points by providing additional insights for informed trading decisions.
Do Professional Traders Use Pivot Points?
Professional traders utilize pivot points extensively to pinpoint crucial support and resistance levels, enabling strategic decision-making. This technical tool aids in establishing optimal entry and exit points, enhancing risk management practices, and refining trading strategies effectively.
How Do You Find the Pivot Point in Technical Analysis?
In technical analysis, the pivot point is derived by averaging the previous day's high, low, and closing prices. This calculation provides a pivotal reference level for traders to assess potential support and resistance areas in the market.
Why Day Traders Prefer Pivot Points Over Other Indicators?
Day traders prefer pivot points due to their ability to provide concise support and resistance levels, aiding in defining entry and exit points with calculated risks. These indicators' ease of use and integration enhance decision-making and risk management in volatile markets.
Conclusion
In conclusion, pivot points offer valuable insights into market trends and support/resistance levels, enhancing technical analysis for traders.
While some may argue that pivot points are based on historical data and may not always accurately predict future market movements, it is crucial to remember that they are just one tool in a trader's arsenal.
By incorporating pivot points into a comprehensive trading strategy alongside other technical indicators, traders can make more informed decisions and optimize outcomes in the financial markets.