
Have you ever wondered that 61.8% is not just a random number but a significant Fibonacci ratio in stock trading? Understanding the Fibonacci retracement levels can be a game-changer in your trading endeavors.
By incorporating these ratios into your technical analysis toolkit, you can potentially uncover hidden opportunities and make more informed trading decisions.
Stay tuned to discover how Fibonacci retracement levels can add a new dimension to your trading strategy and help you navigate the volatile waters of the stock market with more confidence and precision.
Basics of Fibonacci Retracement
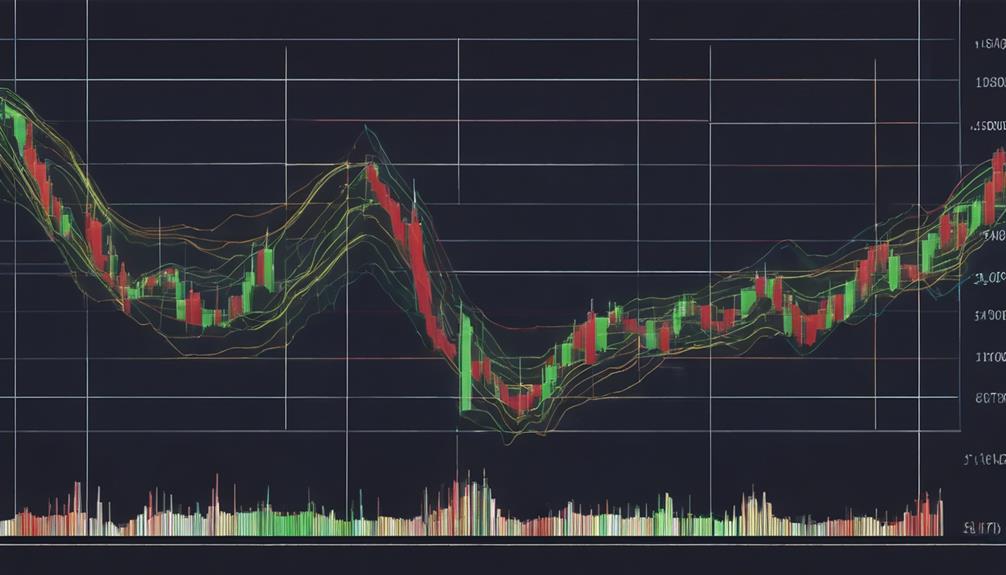
Familiarize yourself with the fundamental principles of Fibonacci retracement, a crucial tool used by stock traders to pinpoint potential areas of support and resistance. Fibonacci retracement is based on key levels such as 23.6%, 38.2%, 50%, 61.8%, and 100%, derived from the Fibonacci sequence of numbers.
Traders employ these ratios to identify potential price levels where the market may reverse or consolidate. By understanding Fibonacci retracement levels, traders can anticipate market movements and make informed decisions. This tool aids in analyzing trends and determining entry and exit points in trades.
Utilizing Fibonacci retracement in trading provides a structured approach to interpreting market behavior and enhances the ability to predict potential support and resistance levels accurately.
Impulse Waves in Trading
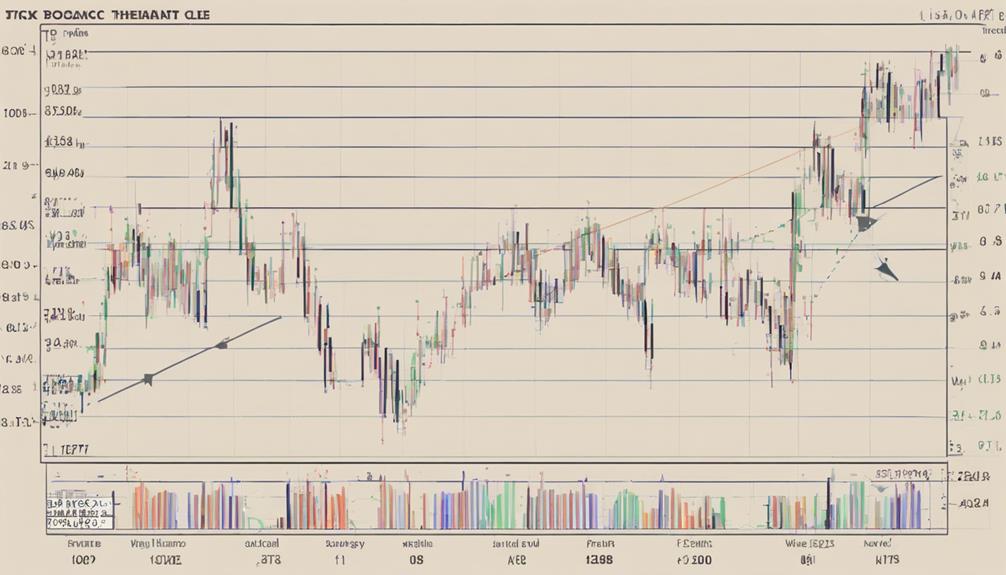
In stock trading, understanding impulse waves as part of Elliott Wave theory is crucial for predicting future price movements and assessing trend strength. Impulse waves, consisting of five-wave patterns, move in the direction of the trend, aiding in predicting future price movements. These waves also indicate trend strength, providing essential insights into market dynamics.
By combining Fibonacci retracements with impulse waves, traders can determine crucial support and resistance levels more effectively. Understanding impulse waves enhances trading strategies, improves decision-making processes, and facilitates trend analysis.
- Impulse waves move in the direction of the trend.
- They help predict future price movements.
- Impulse waves indicate trend strength.
- They're crucial for analyzing market dynamics.
Fibonacci Retracement in Elliott Wave Theory
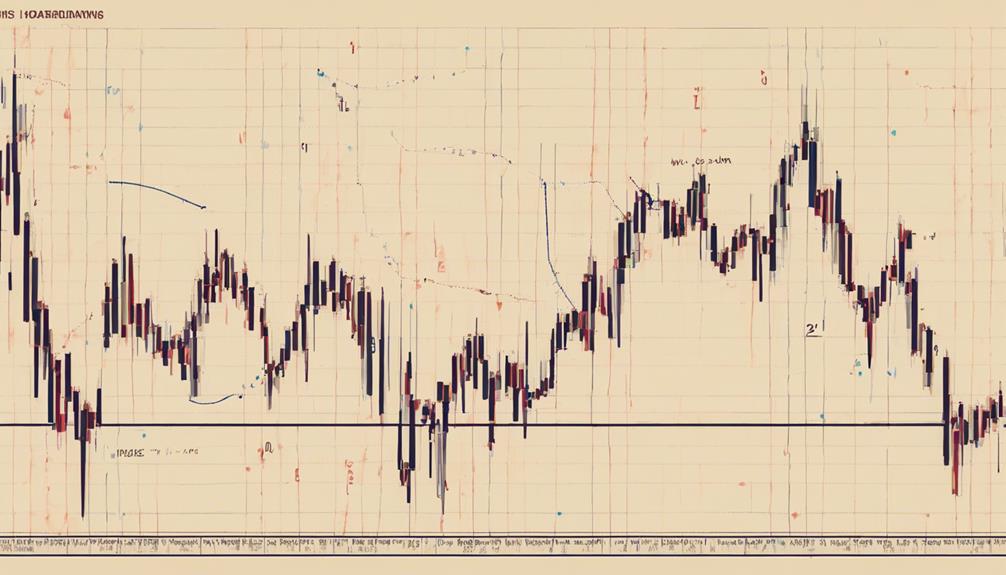
Utilizing Fibonacci retracement within Elliott Wave theory enhances traders' ability to pinpoint key support and resistance levels in market trends, aiding in the analysis of wave patterns and the forecasting of market behavior.
In Elliott Wave theory, impulse waves play a significant role as they move in the direction of the trend, forming part of the five-wave patterns used to predict future price movements. By incorporating Fibonacci retracement into this framework, traders can better understand the structure of market trends and make informed trading decisions.
This combination allows for a deeper analysis of wave patterns, leading to more accurate forecasts and improved trading strategies. Understanding how Fibonacci retracement works within Elliott Wave theory can provide traders with valuable insights into market dynamics and potential price movements.
Drawing Fibonacci Retracement Levels
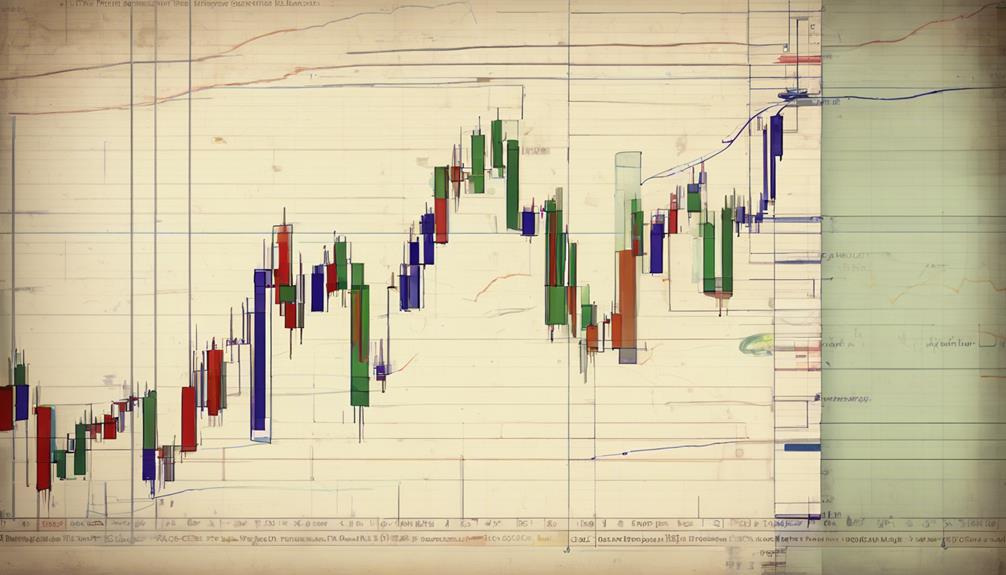
Drawing Fibonacci retracement levels involves identifying key Fibonacci ratios based on significant high and low points in a stock chart. Traders rely on these levels to pinpoint entry points, potential reversal points, and key price levels through the use of the Fibonacci retracement tool. This method is a fundamental aspect of technical analysis, enabling traders to anticipate how the price retraces after a significant move.
By understanding these Fibonacci ratios and plotting them on a chart, traders gain valuable insights into where the price may find support or face resistance, aiding in strategic decision-making.
- Identify significant high and low points
- Plot Fibonacci ratios such as 23.6%, 38.2%, 50%, 61.8%, and 78.6%
- Create horizontal lines for support and resistance levels
- Utilize Fibonacci retracement tool for technical analysis
Trading Strategies With Fibonacci Retracement
Implementing Fibonacci retracement levels in your trading strategies enhances your ability to identify key support and resistance levels for making informed decisions in the stock market.
By utilizing Fibonacci retracement levels such as 23.6%, 38.2%, 50%, 61.8%, and 78.6%, you can predict potential price movements and adjust your trading plans accordingly.
These levels simplify the process of pinpointing support and resistance levels, aiding in identifying areas for profit-taking and short entry points based on potential reversals.
Incorporating Fibonacci strategies into your trading approach helps in anticipating trend changes and timing trades effectively for optimal results.
Utilize Fibonacci retracement levels to enhance your trading strategies and improve decision-making processes in the dynamic stock market environment.
How Can Fibonacci Retracement Help in Predicting Stock Market Reversals?
Many traders use the method of spotting market reversals with Fibonacci to predict stock market reversals. The Fibonacci retracement levels can help identify potential support and resistance levels, allowing traders to make more informed decisions about when to buy or sell stocks.
Frequently Asked Questions
Which Timeframe Is Best for Fibonacci Retracement?
For Fibonacci retracement, the best timeframe depends on your trading strategy. Intraday trading benefits from recent high and low prices, while swing trading uses significant points over a period. Daily charts commonly rely on key levels for trend analysis.
How Do You Use Fibonacci Retracement in Stock Trading?
To use Fibonacci retracement in stock trading, identify potential support and resistance levels by plotting Fibonacci levels like 0.236, 0.382, 0.50, 0.618, and 0.786. This aids in predicting price movements and determining entry/exit points.
Do Professional Traders Use Fibonacci Retracement?
Professional traders commonly use Fibonacci retracement levels like 38.2%, 50%, and 61.8% to identify potential support and resistance in stock trading. These levels aid in predicting price movements, guiding entry and exit decisions for enhanced profitability.
What Is the Golden Level of the Fibonacci Retracement?
In stock trading, the golden level of Fibonacci retracement is 61.8%. Traders often view this as a crucial area for potential reversals. Understanding this level can help you spot important price points for making trading decisions effectively.
Conclusion
In conclusion, incorporating Fibonacci retracement levels in stock trading can greatly enhance your technical analysis skills and improve your trading success.
While some may argue that relying solely on Fibonacci tools can be limiting, the data-driven results speak for themselves.
By utilizing Fibonacci retracement levels in conjunction with other technical indicators, you can create a well-rounded trading strategy that maximizes profit potential and minimizes risk.
Trust in the numbers and let Fibonacci guide your trading decisions.