
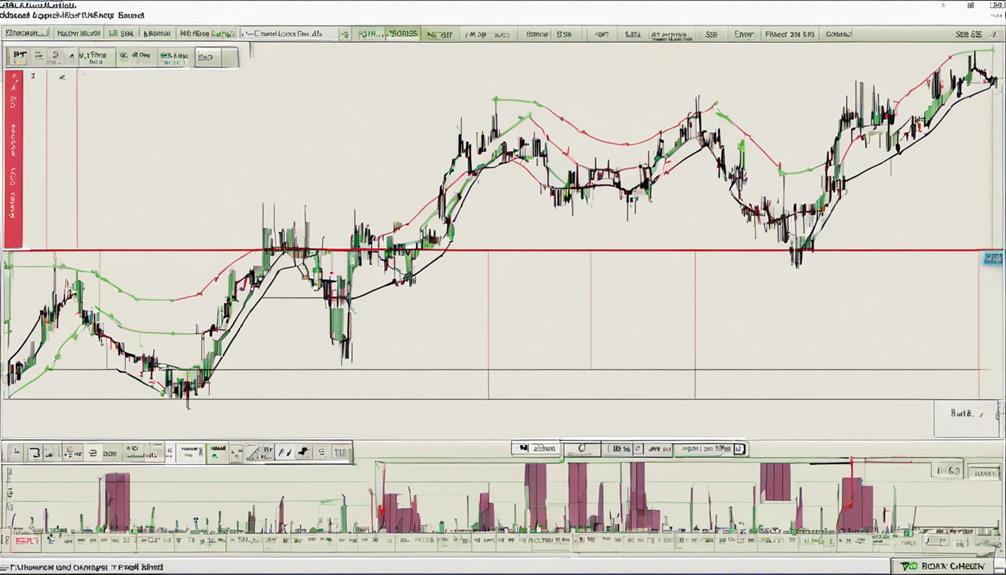
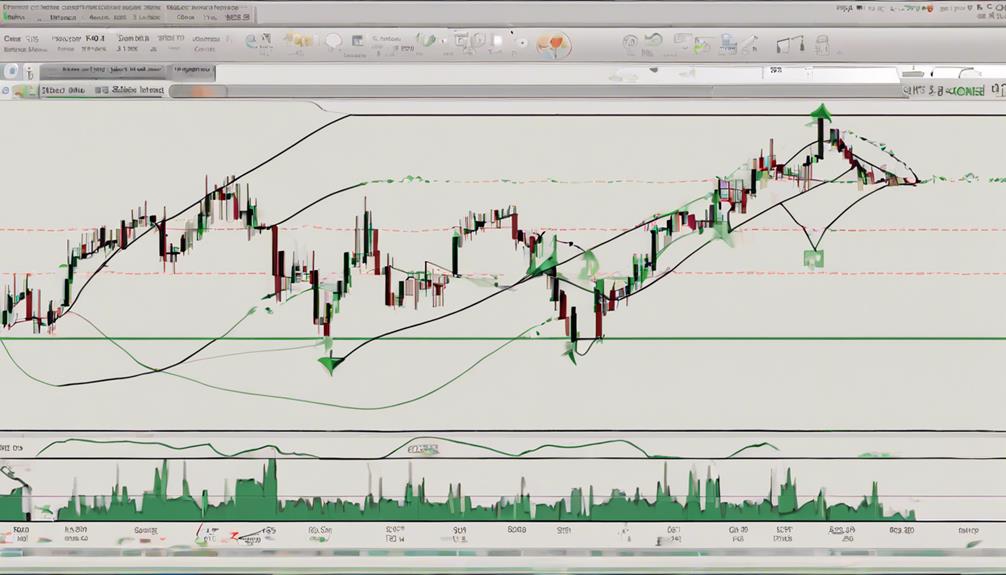
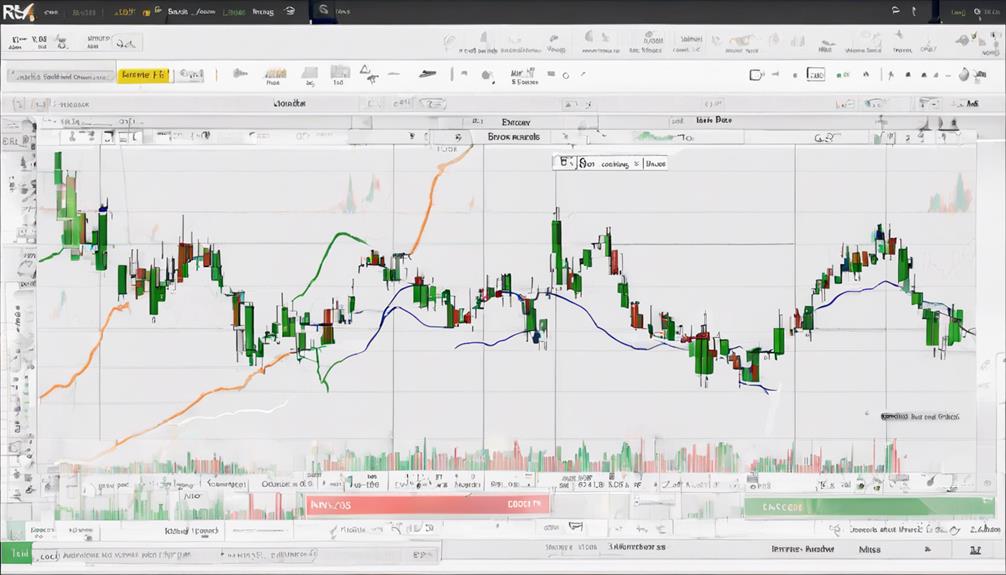
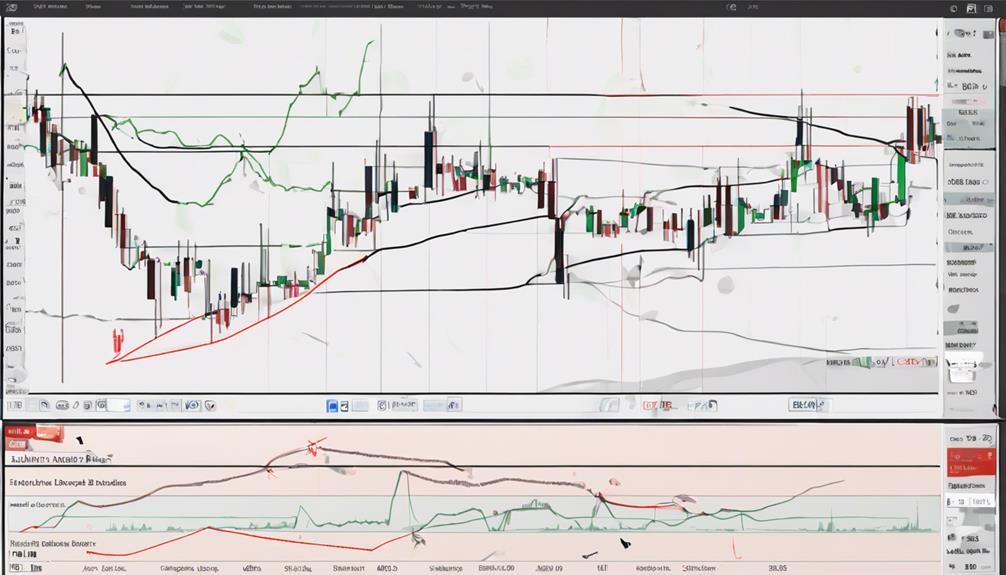
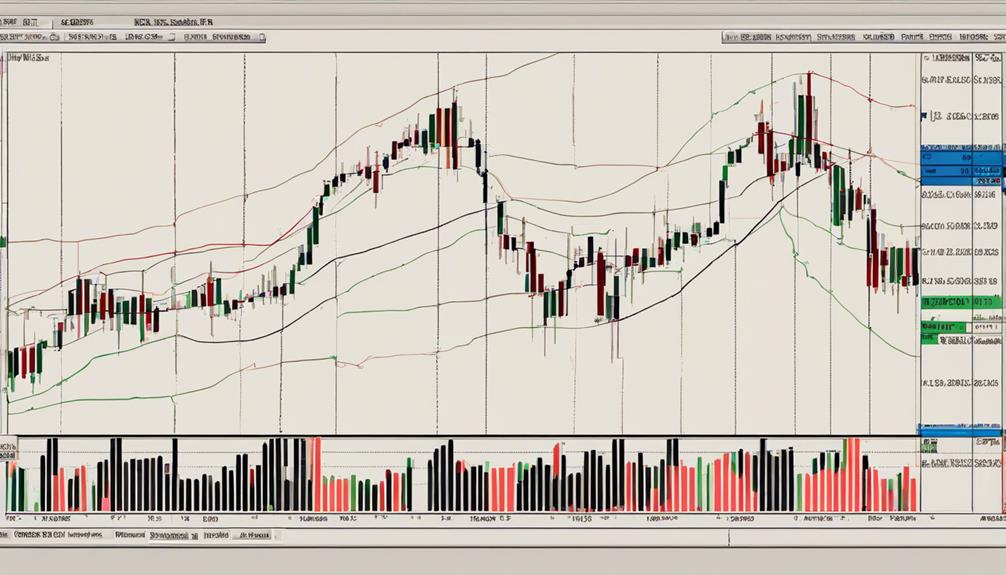
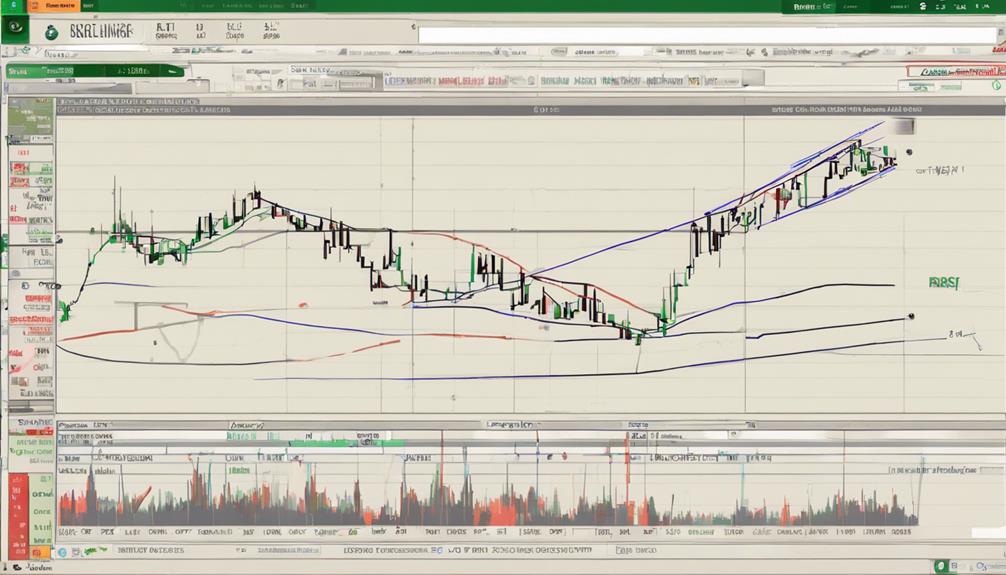
Attain market mastery by employing the RSI and Bollinger Bands strategy, a robust blend of momentum and volatility indicators. RSI helps identify overbought or oversold conditions, whereas Bollinger Bands gauge price volatility and potential breakouts/reversals. Combining these tools offers precise entry and exit points, validating market signals to refine decision-making. The strategic fusion enhances signal accuracy, supports risk management, and optimizes trading performance. By mastering the nuances of this strategy, traders gain a holistic view of market dynamics, empowering them to anticipate trends and capitalize on profitable opportunities. Harness the full potential of RSI and Bollinger Bands synergy for strategic market insights.
RSI Calculation and Interpretation
The calculation and interpretation of the Relative Strength Index (RSI) play a significant role in analyzing market dynamics and identifying potential trading opportunities. RSI is a popular momentum oscillator developed by J. Welles Wilder in 1978. It is calculated using the formula RSI = 100 – (100 / (1 + RS)), where RS represents the average gain divided by the average loss over a specified period.
RSI values range between 0 to 100, with readings above 70 signaling overbought conditions and readings below 30 indicating oversold conditions. Traders frequently use RSI in conjunction with Bollinger Bands to enhance their understanding of market conditions. Combining RSI with Bollinger Bands allows traders to gain insights into both price momentum and volatility, providing a thorough view of potential market extremes.
This synergy between RSI and Bollinger Bands empowers traders to make well-informed decisions by considering both momentum and price volatility simultaneously.
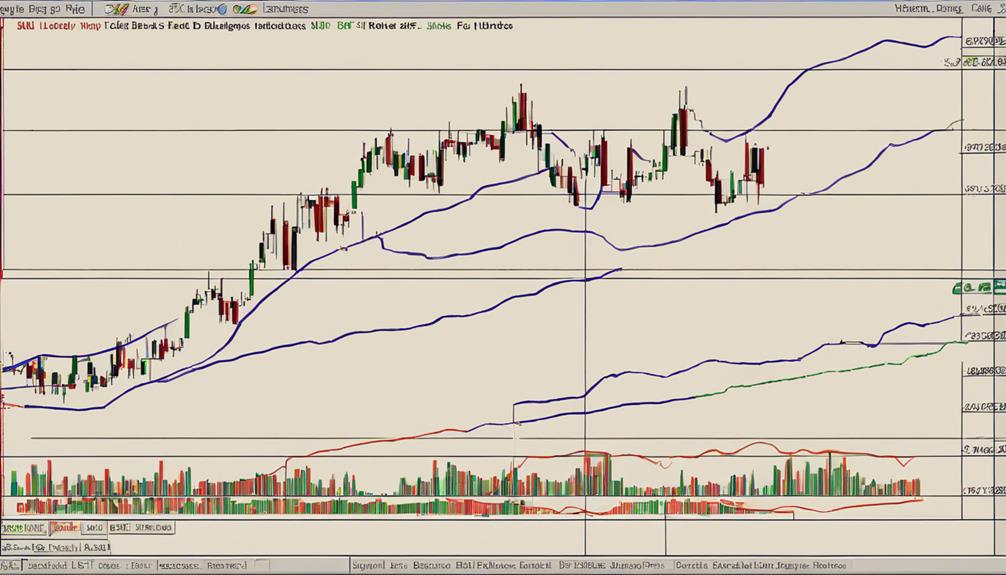
Bollinger Bands Calculation Process
Utilizing a 20-period simple moving average as the foundation, the Bollinger Bands calculation process is essential for evaluating market volatility and potential price movements. The calculation involves:
- Middle Band: The 20-period simple moving average is calculated to establish the Middle Band, representing the mean price over the selected period.
- Upper Band: The Upper Band is computed as the Middle Band plus two standard deviations, indicating potential resistance levels.
- Lower Band: Similarly, the Lower Band is derived by subtracting two standard deviations from the Middle Band, illustrating potential support levels.
- Market Volatility: Bollinger Bands expand during periods of high market volatility and contract during low volatility phases, providing insights into potential price breakouts or reversals.
Through this calculation process, traders can gain a deeper understanding of market dynamics, anticipate price movements, and make informed trading decisions based on the principles of Bollinger Bands.
Example Trade Setups With RSI and Bollinger Bands
Effective trade setups with RSI and Bollinger Bands involve strategic entry points based on specific parameters. By selling when the price reaches the upper band with RSI above 70, traders can capitalize on potential overbought conditions.
Conversely, buying opportunities may arise when RSI falls below the lower band, signaling potential oversold conditions.
Entry Signals With RSI
Enhancing trade entries with Relative Strength Index (RSI) involves identifying key signal points on the indicator's scale and leveraging Bollinger Bands for confirmation. When utilizing RSI for entry signals, traders look for specific conditions to initiate trades effectively.
Here are some examples of trade setups using RSI and Bollinger Bands:
- Buy when RSI crosses above 30 and price touches the lower Bollinger Band.
- Sell when RSI crosses below 70 and price touches the upper Bollinger Band.
- RSI entry signals occur when the indicator crosses above 30 or below 70 on the scale.
- Combining RSI with Bollinger Bands enhances entry confirmation for trades.
This synergy between RSI and Bollinger Bands provides traders with clearer entry points and helps validate market signals efficiently.
Bollinger Bands Parameters
Incorporating specific parameters for Bollinger Bands is essential when executing example trade setups in conjunction with RSI to enhance trading strategies. The standard settings for Bollinger Bands typically involve a 20-period Simple Moving Average (SMA) as the Middle Band, flanked by Upper and Lower Bands calculated using two standard deviations.
Example trade setups with RSI and Bollinger Bands often focus on observing price interactions with these bands in conjunction with RSI readings. For instance, traders may look for instances where the price touches the Upper Band while RSI is above 70, signaling potential overbought conditions. Conversely, price nearing the Lower Band with RSI below 30 can indicate potential oversold conditions.
Understanding these parameters and trade setups with RSI and Bollinger Bands allows traders to leverage both momentum and volatility indicators effectively in their market analysis and decision-making processes.
Trade Management Tips
Building upon the trade setups discussed with RSI and Bollinger Bands, effective management of trades is pivotal to optimizing trading outcomes and risk mitigation strategies.
- Identify Oversold Conditions: Wait for RSI to cross above 30, signaling an oversold condition.
- Execute Buy Signal: Consider a buy signal when the price touches the lower Bollinger Band and RSI confirms the oversold condition below 30.
- Implement Stop-Loss: Manage trades by setting stop-loss orders below the recent swing low to protect against downside risk.
- Spot Sell Signals: Look for a sell signal when price reaches the upper Bollinger Band and RSI indicates an overbought condition above 70.
Monitoring trade setups with RSI and Bollinger Bands allows for potential reversals or continuation patterns in the market.
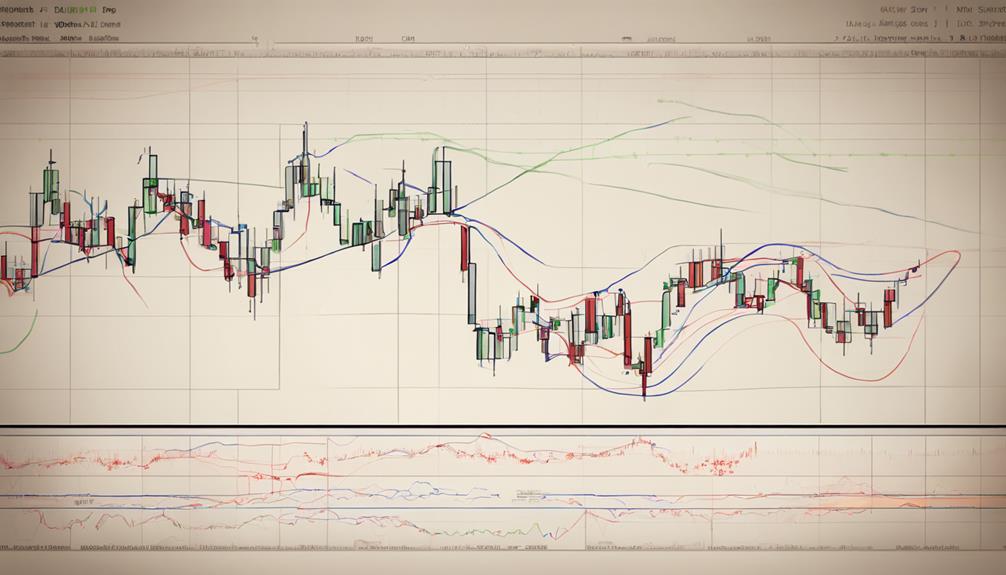
Utilizing RSI and Bollinger Bands Together
When combining the Relative Strength Index (RSI) with Bollinger Bands, traders gain a comprehensive view of both price momentum and market volatility.
The RSI exceeding the upper Bollinger Band indicates potential overbought conditions in the market, suggesting a possible reversal or pullback.
Conversely, when the RSI drops below the lower Bollinger Band, it may signal oversold market conditions, indicating a potential buying opportunity.
By utilizing RSI in conjunction with Bollinger Bands, traders can better confirm or reject market signals, leading to more informed trading decisions.
The interaction between RSI and Bollinger Bands plays an essential role in guiding traders on when to buy or sell assets based on market conditions.
Advantages of RSI-Bollinger Bands Combo
The combination of RSI and Bollinger Bands offers traders enhanced signal accuracy, allowing for more precise market timing decisions.
Additionally, this strategy aids in improved risk management by providing a thorough analysis of price momentum and volatility.
Enhanced Signal Accuracy
The amalgamation of the Relative Strength Index (RSI) and Bollinger Bands exhibits a distinct advantage in bolstering signal precision by corroborating or refuting trading indications. When used together, these two technical indicators offer enhanced signal accuracy through the following mechanisms:
- Validating Overbought and Oversold Conditions: RSI helps confirm signals from Bollinger Bands regarding overbought and oversold levels.
- Identifying Market Extremes: Bollinger Bands assist in pinpointing market extremes, while RSI provides insights into price momentum.
- Comprehensive Market Analysis: Integrating RSI with Bollinger Bands offers a holistic approach to market analysis and decision-making.
- Avoiding False Signals: By combining RSI and Bollinger Bands, traders can steer clear of erroneous trading signals and make more informed decisions.
Improved Risk Management
Integrating the RSI-Bollinger Bands strategy not only enhances signal accuracy but also greatly improves risk management in trading scenarios. By combining RSI and Bollinger Bands, traders can set precise stop-loss levels based on market volatility, leading to better risk management.
This strategy provides clear entry and exit signals, reducing the likelihood of false trading signals and enhancing decision-making accuracy. The RSI-Bollinger Bands combo optimizes trading strategies by effectively managing risks, allowing traders to adapt to changing market conditions for improved risk mitigation.
Tips for Trading With RSI and Bollinger Bands
When trading with RSI and Bollinger Bands, strategic implementation is key to maximizing market insights and optimizing trading decisions. To effectively utilize these technical indicators, consider the following tips:
- Confirmation Signals: Use RSI with Bollinger Bands to confirm trade signals and identify potential market extremes accurately.
- Risk Management: Set specific stop-loss and take-profit levels based on the signals generated by RSI and Bollinger Bands to manage risk effectively while trading.
- Historical Validation: Test the RSI with Bollinger Bands indicator on historical data to validate its reliability and performance in different market conditions.
- Enhanced Decision-making: Incorporate RSI with Bollinger Bands for enhanced decision-making and market analysis, utilizing RSI breaches of Bollinger Bands to predict market conditions accurately.
Incorporating Strategy in Different Markets
Adapting the RSI and Bollinger Bands strategy to diverse markets requires a nuanced understanding of their unique characteristics and dynamics. Different asset classes like stocks, forex, cryptocurrencies, and commodities have varying market dynamics and volatility levels that can impact the effectiveness of the RSI and Bollinger Bands strategy.
Traders must be aware of these differences to tailor their approach accordingly. For instance, stocks may exhibit different price movements and liquidity compared to cryptocurrencies, influencing the parameters used for the RSI and Bollinger Bands indicators.
Additionally, adapting the strategy to specific market hours and trading sessions can also play a significant role in its success. By considering these factors and adjusting the strategy to suit the behavior of different markets, traders can optimize their use of the RSI and Bollinger Bands indicators to identify profitable trading opportunities across various asset classes.
Bollinger Bands and RSI Indicator Integration
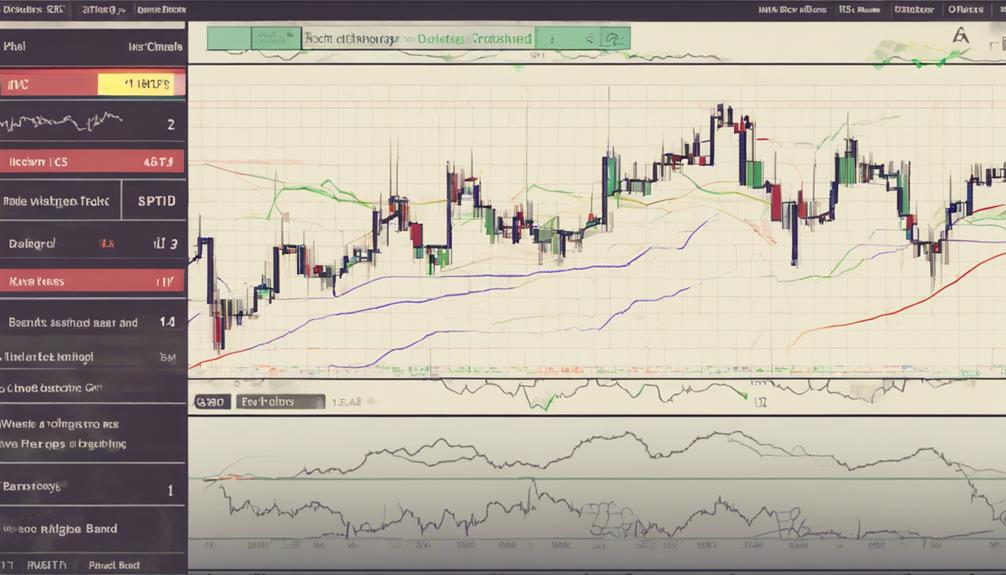
Integrating the RSI indicator with Bollinger Bands enhances traders' ability to interpret market dynamics effectively. By understanding the basics of RSI and Bands and how their signals integrate, traders can make informed decisions.
Implementing this integrated strategy involves paying attention to key indicator breaches and utilizing them for strategic market analysis.
RSI and Bands Basics
By integrating the Bollinger Bands, which consist of three lines based on moving averages and standard deviations, with the Relative Strength Index (RSI) indicator, traders can gain valuable insights into market conditions and confirm trade signals effectively. When understanding the basics of RSI and Bands integration:
- Bollinger Bands offer visual representations of price volatility.
- RSI measures the velocity and magnitude of price movements.
- RSI surpassing the upper band suggests overbought market conditions.
- RSI falling below the lower band indicates potential oversold scenarios.
This combination of technical analysis tools allows traders to gauge momentum and identify potential reversal points based on overbought or oversold conditions, enhancing their decision-making process in response to price movements.
Indicator Signals Integration
The synergy between Bollinger Bands and the Relative Strength Index (RSI) indicator in trading provides a robust framework for confirming buy or sell signals and evaluating market conditions effectively.
Integrating RSI with Bollinger Bands allows traders to enhance decision-making by leveraging the complementary signals generated by these two indicators. When the RSI crosses the upper Bollinger Band, it may signal a potential overbought condition, suggesting a sell opportunity.
Conversely, a drop in RSI below the lower Bollinger Band could indicate an oversold market, potentially signaling a buy opportunity. By utilizing RSI breaches of Bollinger Bands, traders can anticipate potential market reversals or continuations, enabling them to make more informed trading decisions based on the combined insights provided by these indicators.
Strategy Implementation Tips
To optimize the effectiveness of combining the Relative Strength Index (RSI) with Bollinger Bands in trading, strategic implementation tips play a pivotal role in enhancing decision-making and risk management.
- Confirm Trade Signals: Use RSI in conjunction with Bollinger Bands to validate trade signals and identify potential market extremes.
- Precise Risk Management: Set specific stop-loss and take-profit levels by integrating RSI and Bollinger Bands for effective risk management.
- Historical Data Testing: Prior to live trading, test historical data to make sure the reliability and efficiency of the integrated RSI and Bollinger Bands strategy.
- Enhanced Decision-Making: Improve decision-making by utilizing RSI breaches of Bollinger Bands as predictive indicators for market conditions, enhancing the accuracy of trade signals and overall market analysis.
Enhancing Trading Performance With RSI and Bollinger Bands
Harnessing the synergies between RSI and Bollinger Bands can greatly improve traders' performance in maneuvering through the intricacies of the financial markets. RSI, a momentum oscillator, and Bollinger Bands, volatility indicators, offer valuable insights when combined in a trading strategy. RSI helps identify overbought and oversold conditions, while Bollinger Bands provide a visual representation of price volatility and potential market extremes. By integrating these tools, traders can make more informed decisions based on a thorough analysis of market conditions.
When RSI values exceed 70 or drop below 30, traders can anticipate potential reversals or continuation of trends, especially when aligned with Bollinger Bands' upper and lower boundaries. This collaboration enhances the accuracy of trading signals, reducing false indications and improving decision-making processes. The Middle Band of the Bollinger Bands acts as a reference point for the average price, aiding traders in evaluating the strength of trends.
Risk Management Strategies for RSI-Bollinger Bands
Aligning risk management practices with the combined signals of RSI and Bollinger Bands is imperative for optimizing trading outcomes and safeguarding against potential losses in financial markets. When implementing the RSI-Bollinger Bands strategy, the following risk management strategies are key to success:
- Set stop-loss levels based on Bollinger Bands' volatility indications to effectively manage risk exposure.
- Determine take-profit targets aligned with RSI signals to capitalize on favorable trade opportunities.
- Validate trade entries and exits using a combination of RSI and Bollinger Bands signals to enhance decision-making.
- Adjust position sizes based on Bollinger Bands and RSI indications to control risk exposure and capitalize on profitable opportunities.
Adjusting Strategy to Market Conditions
Adapting the RSI and Bollinger Bands strategy necessitates a vital awareness of shifting market conditions to optimize trading performance. To adjust the strategy effectively, traders must consider factors such as market volatility and trading ranges.
Understanding market trends and patterns is essential for fine-tuning the strategy to align with the current market environment. Flexibility plays a significant role in adjusting parameters like period lengths and standard deviations based on the dynamics of the market.
Monitoring key indicators such as RSI levels and Bollinger Bands width can provide valuable insights for making timely adjustments. Reacting promptly to changes in price action and volume by tweaking the strategy parameters ensures that it remains in line with the prevailing market behavior.
Using RSI and Bollinger Bands for Profitable Trades
Utilizing the Relative Strength Index (RSI) in conjunction with Bollinger Bands can provide valuable entry signals for traders.
The RSI can offer insights into overbought or oversold conditions, while the Bollinger Bands help assess market volatility.
Entry Signals With RSI
When considering profitable trades, the strategic combination of RSI and Bollinger Bands for entry signals proves to be a valuable tool for traders seeking to capitalize on market movements.
- Entry signals with RSI occur when the RSI crosses above 30 for buy signals or below 70 for sell signals.
- Combining RSI with Bollinger Bands helps traders identify potential market entry points based on price momentum.
- RSI values below 30 near the lower Bollinger Band can signal a potential buying opportunity.
- Utilizing RSI and Bollinger Bands together enhances the accuracy of entry signals and reduces false trading signals.
Traders can use these signals to confirm market trends and make well-informed decisions on when to enter or exit positions effectively.
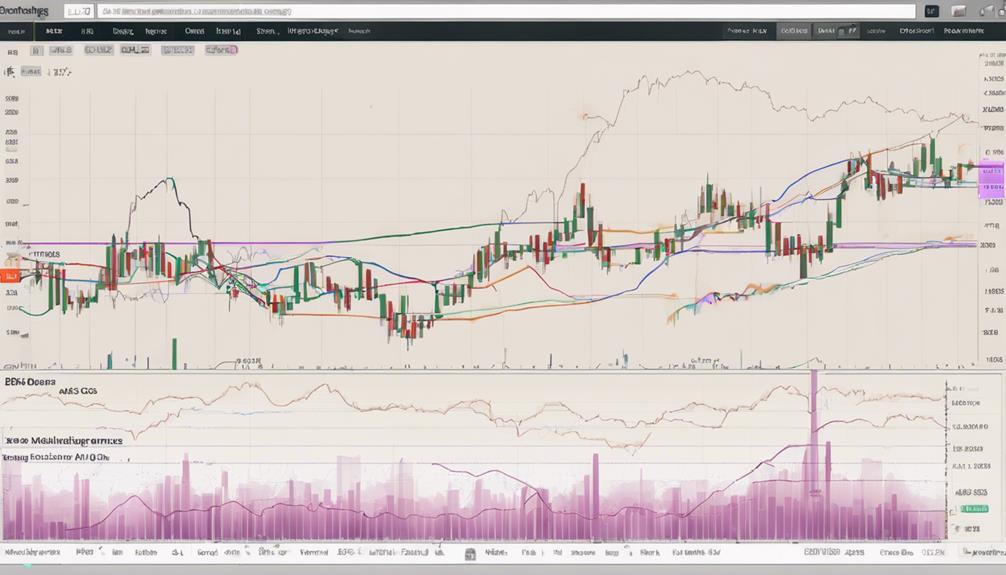
Volatility Analysis Using Bands
Analyzing market volatility through the lens of Bollinger Bands and RSI offers traders a robust framework for identifying and capitalizing on profitable trade opportunities. Bollinger Bands expanding during high volatility serve as a signal for potential price breakouts or reversals, while RSI can validate these signals, aiding in making informed trading decisions.
The combination of RSI and Bollinger Bands is particularly effective in pinpointing profitable trade setups amidst market volatility. By conducting volatility analysis using these tools, traders can determine ideal entry and exit points with greater precision.
Monitoring Bollinger Bands and RSI in tandem provides a thorough understanding of market volatility dynamics, enabling traders to execute trades that align with profitable outcomes.
Trading Insights With RSI and Bollinger Bands
Incorporating RSI and Bollinger Bands into trading strategies provides valuable insights into market dynamics and potential opportunities for traders. When utilizing these technical indicators, traders can benefit from the following insights:
- Price Momentum: RSI measures the speed and change of price movements, while Bollinger Bands capture volatility and potential reversals, offering a thorough view of price momentum.
- Market Signals: RSI values above 70 signal overbought conditions, indicating a potential reversal or correction, whereas values below 30 suggest oversold conditions, highlighting potential buying opportunities.
- Interpretation: Combining RSI with Bollinger Bands enables traders to interpret market signals more effectively, allowing for informed decision-making in trading activities.
- Enhanced Trading Strategy: Understanding the interplay between RSI and Bollinger Bands is essential for refining trading strategies, optimizing entry and exit points, and ultimately mastering market analysis.
Mastering the RSI-Bollinger Bands Strategy
Building upon the insights gained from integrating RSI and Bollinger Bands into trading strategies, mastering the RSI-Bollinger Bands Strategy involves a thorough approach to market analysis and decision-making. This strategy leverages the strengths of both indicators – RSI helps in identifying overbought and oversold conditions, while Bollinger Bands assist in capturing price volatility. By combining these aspects, traders can confirm trade signals, set appropriate stop-loss levels, and manage risk effectively. One key aspect of mastering this strategy is using RSI breaches of Bollinger Bands to anticipate potential market reversals. Additionally, optimizing the settings of both RSI and Bollinger Bands further enhances the accuracy and reliability of this approach. Below is a table summarizing the key points of the RSI-Bollinger Bands Strategy:
| Aspect | Description | Benefit |
|---|---|---|
| Identifying Conditions | RSI detects overbought and oversold levels | Helps in timing entry and exit points |
| Volatility Capture | Bollinger Bands track price volatility | Aids in determining market trends |
| Trade Confirmation | Strategy confirms signals for trades | Enhances decision-making process |
| Risk Management | Setting stop-loss levels based on indicators | Improves overall risk management |
Improving Trading Success With Rsi-Bollinger Bands Approach
Enhancing trading proficiency through the utilization of the RSI-Bollinger Bands methodology is pivotal for achieving improved success in maneuvering the financial markets. To enhance trading success with the RSI-Bollinger Bands approach, consider the following:
- Identifying Market Conditions: Utilize RSI and Bollinger Bands to efficiently identify overbought and oversold market conditions.
- Holistic View: Combine RSI with Bollinger Bands to gain a holistic view of price momentum and volatility.
- Anticipating Market Movements: Use RSI breaches of Bollinger Bands to anticipate potential market reversals or breakouts.
- Risk Management: Implement proper risk management techniques and set stop-loss levels to mitigate risks when applying the RSI-Bollinger Bands strategy.
Additionally, conducting thorough backtesting with historical data using the RSI-Bollinger Bands strategy can provide valuable insights into its effectiveness before live trading. By incorporating these strategies and principles, traders can improve their trading success and navigate the financial markets more effectively.
Frequently Asked Questions
How Do You Use Bollinger Bands and RSI Together?
When combining Bollinger Bands and RSI, traders can identify overbought conditions, potential trend reversals, and price momentum. RSI divergence from price movements and Bollinger squeeze patterns indicate impending volatility breakouts.
Monitoring RSI values exceeding 70 in conjunction with hitting the upper band can signal ideal sell opportunities. This collaboration offers a thorough view of market conditions, aiding in strategic decision-making for traders seeking to navigate various market scenarios effectively.
Which One Is More Effective, RSI or Bollinger Bands?
When comparing RSI and Bollinger Bands, both have distinct strengths. RSI is effective in identifying overbought and oversold conditions, providing accurate signals for potential reversals.
In contrast, Bollinger Bands excel in capturing volatility and are reliable for spotting price breakouts. While RSI may have limitations in certain market conditions, Bollinger Bands offer advantages in adapting to various market trends.
Understanding the applications of both indicators can lead to a well-rounded trading approach.
What Is the Best Indicator to Combine With Bollinger Bands?
When seeking the best indicator to complement Bollinger Bands, factors like market conditions and trading goals are paramount.
The MACD indicator provides insights into trend strength and potential crossovers, enhancing Bollinger Bands' signals.
Alternatively, the Stochastic oscillator can identify overbought or oversold conditions when combined with Bollinger Bands.
Moving averages offer trend confirmation, Fibonacci retracement aids in identifying key levels, while volume analysis and support resistance levels can provide additional confirmation to Bollinger Bands' signals.
What Is the Best Strategy for Bollinger Bands?
The best strategy for Bollinger Bands involves optimizing the band settings to suit the specific trading timeframe and asset characteristics.
By combining Bollinger Bands with RSI, traders can effectively identify price extremes, volatility, trends, breakouts, and reversals in the market.
Paying attention to RSI overbought conditions, Bollinger Bands squeeze, RSI divergence signals, Bollinger Bands width, and RSI trend confirmation can enhance market analysis and decision-making processes.
Conclusion
To sum up, mastering the RSI and Bollinger Bands strategy requires a thorough understanding of their calculations, interpretation, and application in trading.
By combining these two technical indicators, traders can identify potential trade setups, improve trading success, and make profitable decisions in the market.
How can you leverage the power of RSI and Bollinger Bands to enhance your trading strategy and achieve consistent results?