
When it comes to navigating the complex world of trading, understanding the basics of trend following indicators is like having a compass in a sea of uncertainty.
From Simple Moving Averages to MACD and ADX, these tools provide invaluable insights into market trends and potential entry/exit points.
But how do you know which indicators to use and when? Stay tuned to uncover the secrets behind these indicators and how they can elevate your trading game to new heights.
Simple Moving Average (SMA)
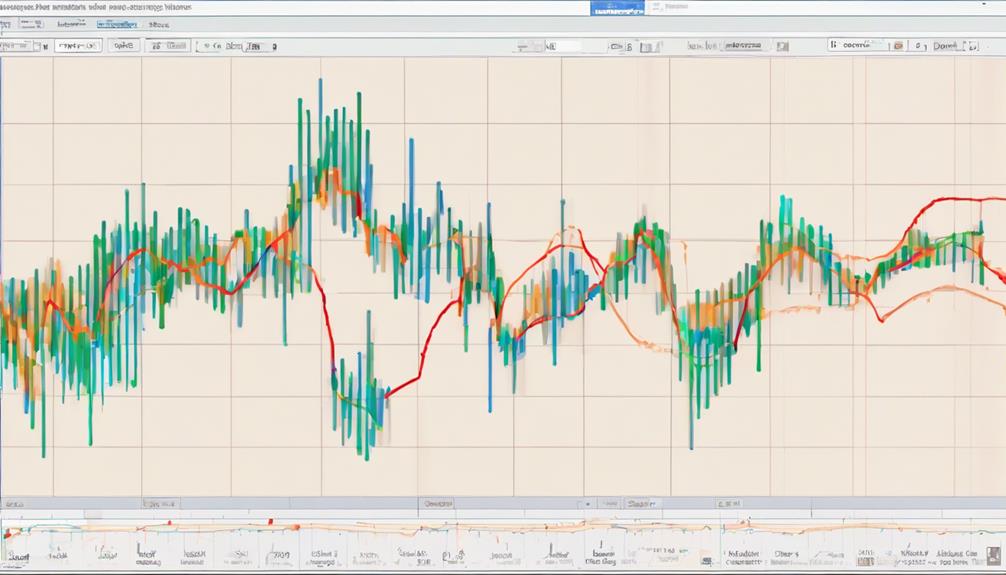
Calculating the average price over a specific time period, the Simple Moving Average (SMA) helps smoothen price data for easier trend identification by traders. By lagging behind the current price action, SMA enables the identification of trend changes.
Traders utilize different SMA lengths, such as 50-day, 100-day, or 200-day, to analyze short-term or long-term trends effectively. The crossovers of SMAs, where shorter-term SMA crosses above or below longer-term SMA, serve as potential signals for trend reversals.
As a fundamental tool in technical analysis, SMA is widely utilized by traders to determine trend direction and pinpoint possible entry or exit points in the market.
Exponential Moving Average (EMA)
When utilizing Exponential Moving Average (EMA) in your analysis, you benefit from its responsiveness to current market conditions due to its weighting of recent price data. EMA reacts swiftly to price changes, aiding in quick trend identification.
Traders commonly use EMA in combination with other indicators to confirm trend direction and generate buy/sell signals based on short-term price movements. This indicator excels at providing timely insights into market trends, allowing you to make informed decisions.
Average Directional Index (ADX/DMS)
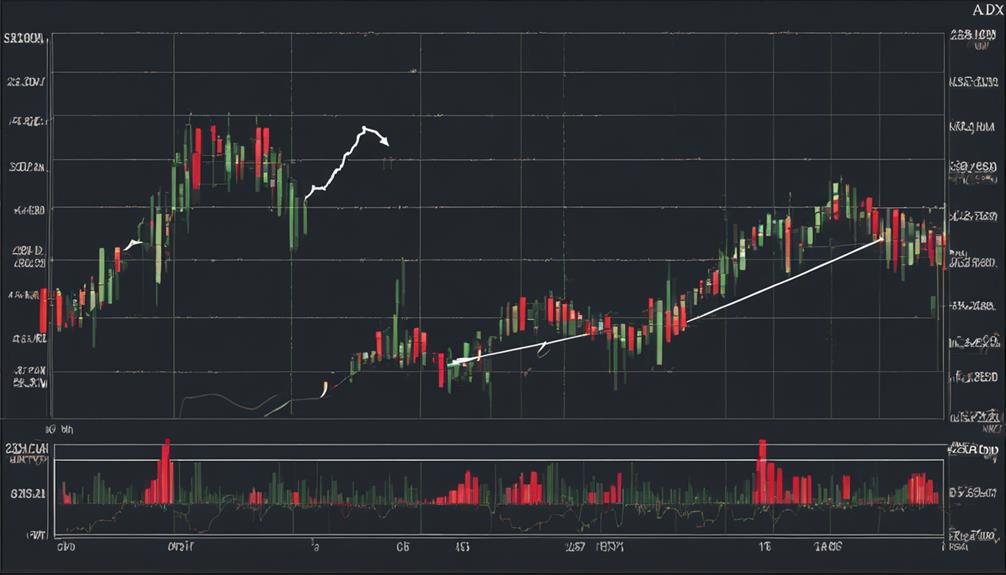
The Average Directional Index (ADX/DMS) provides traders with a reliable tool to gauge the strength of market trends, aiding in the identification of potential trading opportunities.
- The ADX assigns values from 0 to 100 to measure trend strength.
- Higher ADX values indicate stronger trends, while lower values suggest weaker trends or sideways movement.
- ADX helps identify trend direction and strength, filtering out false signals in volatile markets.
- Combining ADX with other technical indicators can enhance trend-following strategy accuracy.
Moving Average Convergence-Divergence (MACD)
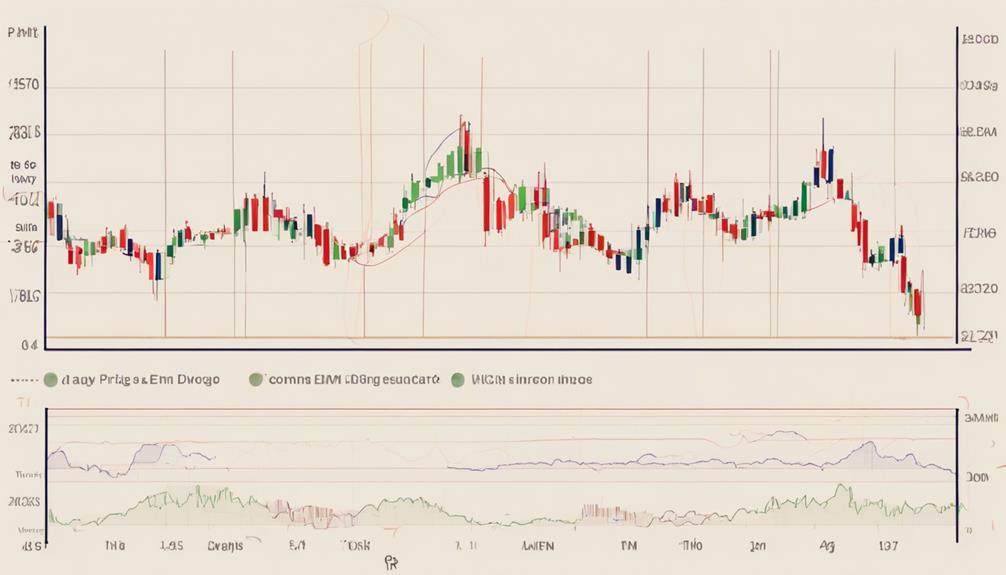
Utilizing a combination of moving averages at different intervals, the Moving Average Convergence-Divergence (MACD) is an essential oscillating indicator for determining trend direction and momentum in the market.
The MACD consists of a MACD line and a signal line, where crossovers between these lines signal potential buy or sell opportunities. Values above zero on the MACD indicate an uptrend, while values below zero suggest a downtrend.
While MACD is a lagging indicator, traders often use it alongside other technical analysis tools to confirm trend signals. Despite its lagging nature, the MACD can effectively capture trends and momentum shifts in the market, making it a valuable tool for traders seeking to navigate the complexities of market movements.
Parabolic Stop and Reverse (Parabolic SAR)
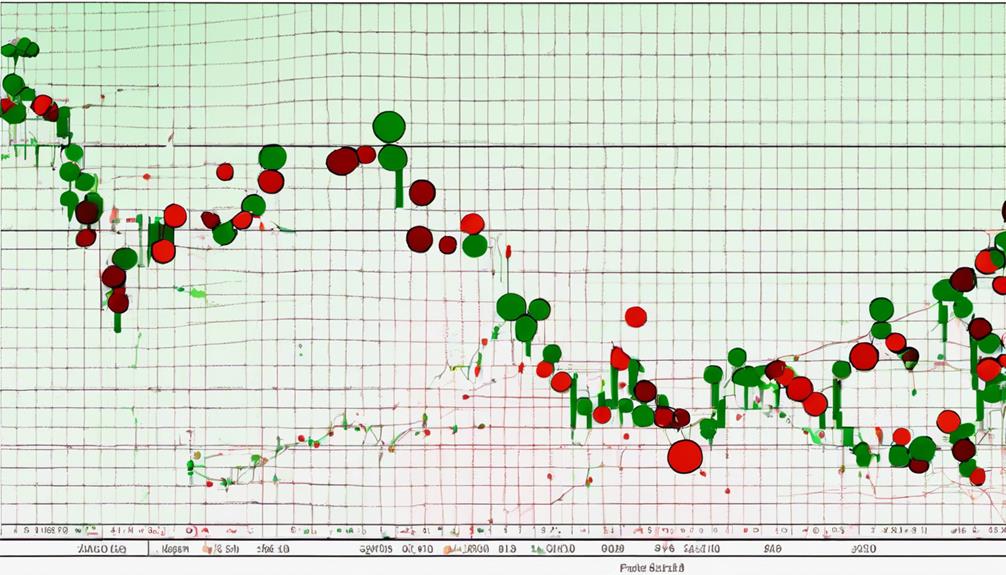
Transitioning from the Moving Average Convergence-Divergence (MACD), the Parabolic Stop and Reverse (Parabolic SAR) is a dynamic indicator that provides support and resistance levels on a chart.
- Parabolic SAR helps identify trend direction and potential reversal points.
- It appears as dots above or below the price, signaling entry or exit points.
- Particularly effective in trending markets, it aids in managing positions efficiently.
- Traders often combine Parabolic SAR with other indicators for more accurate trading signals.
– What Are the Key Components or Elements of Trend Following Indicators?
Trend following indicators rely on the fundamentals of trend following to identify key components. These indicators typically include moving averages, price momentum, and volume trends. By analyzing these elements, traders can make more informed decisions about when to enter and exit trades based on market trends.
Frequently Asked Questions
What Are the Basics of Trend Following?
You track market trends by buying during upswings and selling during downs. Focus on existing trends instead of predicting. Exiting at key trend shifts boosts gains. Recognize uptrends, downtrends, or sideways movements for strategic entries and exits.
What Are the Indicators for Determining Trend?
To determine trends, use indicators like Moving Averages, ADX, MACD, Parabolic SAR, Alligator, and Supertrend. They analyze price movements, signal trend strength, and provide entry/exit points. Incorporate these tools for effective trend identification and decision-making.
What Is the Indicator of a Trend?
To identify a trend, use trend indicators like moving averages or MACD. They show if the market moves up, down, or sideways, guiding entry and exit points. Mastering these tools is vital for effective trend-following strategies.
What Are the 4 Types of Indicators?
Identify trend strength with Moving Average, Exponential Moving Average, Average Directional Index, and Parabolic SAR. They smooth fluctuations, weigh recent data, measure trend strength, and show support/resistance levels. Combine for accurate trend analysis.
Conclusion
In conclusion, mastering the basics of trend following indicators like SMA, EMA, ADX, MACD, and Parabolic SAR is crucial for successful trading. By understanding these indicators and their signals, you can confidently navigate market trends and make informed decisions.
Remember, the key to effective trading lies in combining these tools strategically and staying disciplined in your approach. So, keep analyzing, keep learning, and keep trading smartly to stay ahead in the market game.
After all, knowledge is power.