
Imagine navigating through the financial markets with a reliable compass guiding your every move.
The Ichimoku Cloud Indicator serves as just that, offering a holistic perspective on price action dynamics.
As you delve into the world of this powerful tool, understanding its components and signals can significantly enhance your trading decisions.
From demystifying support and resistance levels to unlocking the secrets of market momentum, the Ichimoku Cloud holds the key to unlocking a realm of possibilities in your trading journey.
Understanding the Ichimoku Cloud Components
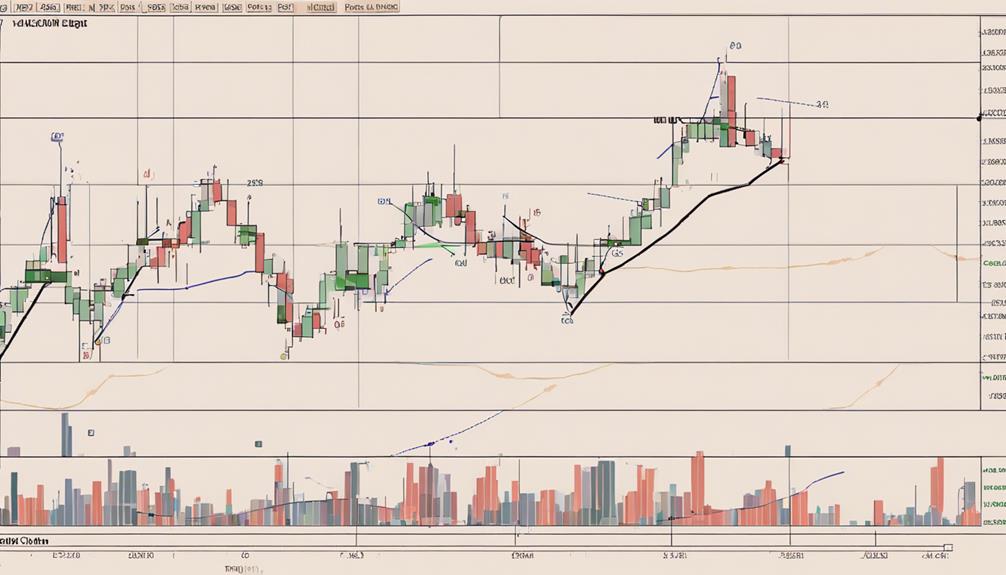
To comprehend the Ichimoku Cloud indicator effectively, familiarize yourself with its five essential components.
The Tenkan-Sen represents the average price movement over the last 9 periods, while the Kijun-Sen reflects the average over 26 periods. These two lines provide insight into short-term and medium-term price trends.
The Chikou Span acts as a lagging confirmation line, plotting the closing price 26 periods behind to validate trend signals.
Senkou Span A is derived from the average of Tenkan-Sen and Kijun-Sen, while Senkou Span B is calculated from the average price extremes over the past 52 periods.
Together, these components form the Ichimoku Cloud, offering a comprehensive view of potential support, resistance, and trend direction in the market.
Interpreting Ichimoku Cloud Signals
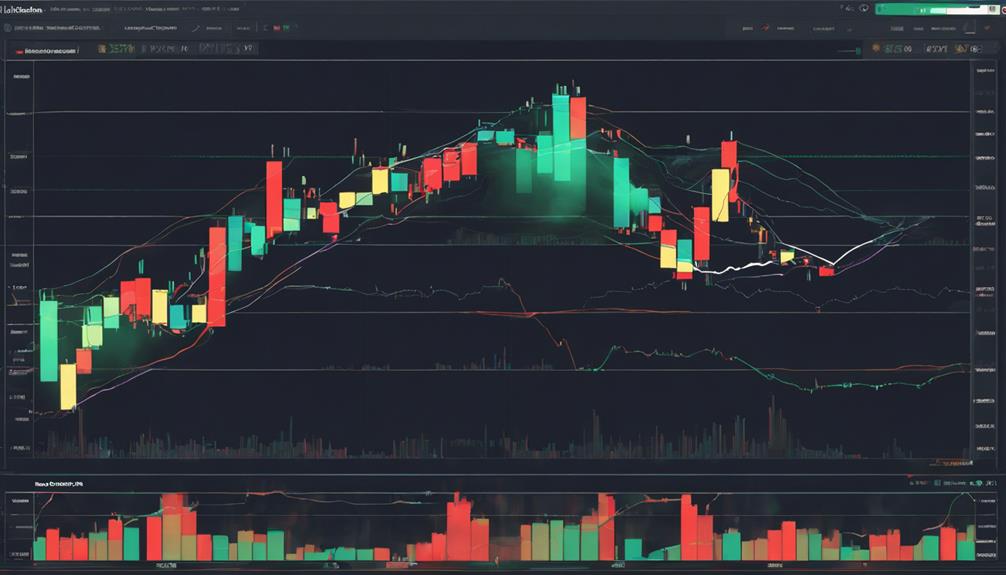
With a solid grasp of the Ichimoku Cloud components, you can now decipher the intricate signals this indicator provides for strategic market analysis. The Ichimoku Cloud offers various signals that can help you understand market trends and make informed decisions:
- Trend Signals: The relationship between the Conversion Line and Base Line can indicate the direction of the trend. When the Conversion Line is above the Base Line, it suggests a bullish trend, while the opposite indicates a bearish trend.
- Lagging Span Confirmation: The Chikou Span, plotting past closing prices, can confirm trend signals. If the Chikou Span is above the price curve, it supports a bullish trend, and vice versa.
- Leading Span Crosses: Crossovers between Leading Span A and Leading Span B can signal potential trend changes. When Leading Span A is above B, it indicates a bullish market sentiment, and the opposite suggests a bearish outlook.
Utilizing Ichimoku Cloud for Trading
One effective way to maximize the benefits of the Ichimoku Cloud in your trading strategy is by leveraging the crossovers between Tenkan-sen and Kijun-sen for timely buy/sell signals and trend reversal indications. These crossovers are crucial entry and exit points in your trades.
By paying attention to the interaction between these lines, you can determine potential buy signals when the Tenkan-sen crosses above the Kijun-sen, and sell signals when the opposite occurs.
Additionally, the Ichimoku cloud system can help you identify support and resistance levels, aiding in making informed decisions based on price action and technical analysis. Successfully utilizing the Ichimoku cloud indicator can enhance your ability to interpret trends and optimize your trading performance.
Practical Application of Ichimoku Cloud
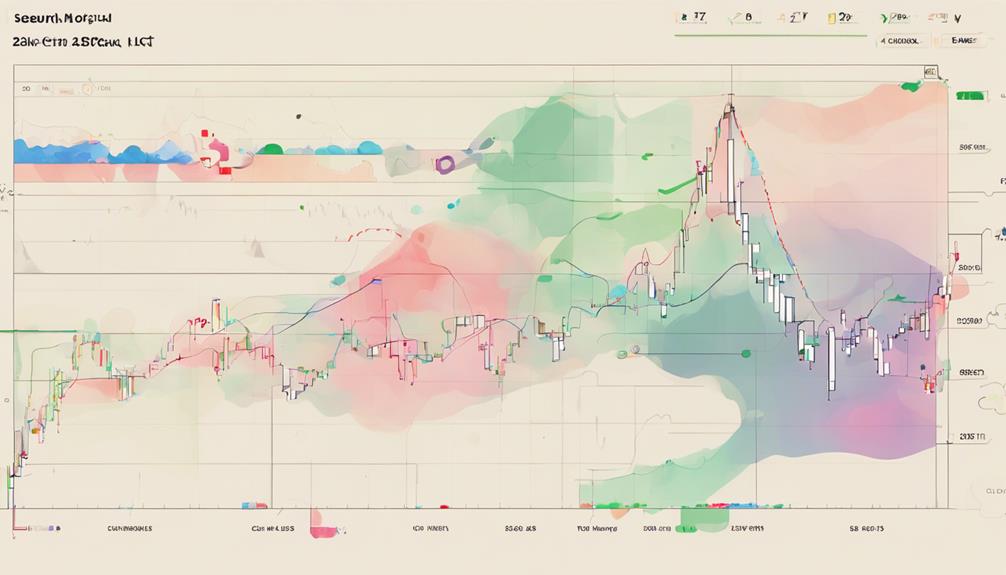
When applying the Ichimoku Cloud indicator practically, you can effectively utilize its features to identify key support and resistance levels in the market, offering valuable insights for your trading decisions.
- The indicator helps in recognizing buy signals when the price is above the Cloud, indicating a potential uptrend.
- Conversely, sell signals can be identified when the price is below the Cloud, signaling a possible downtrend.
- By analyzing the Cloud's thickness, traders can assess market volatility, which is crucial for understanding potential price movements.
Maximizing Profits With Ichimoku Cloud Strategy
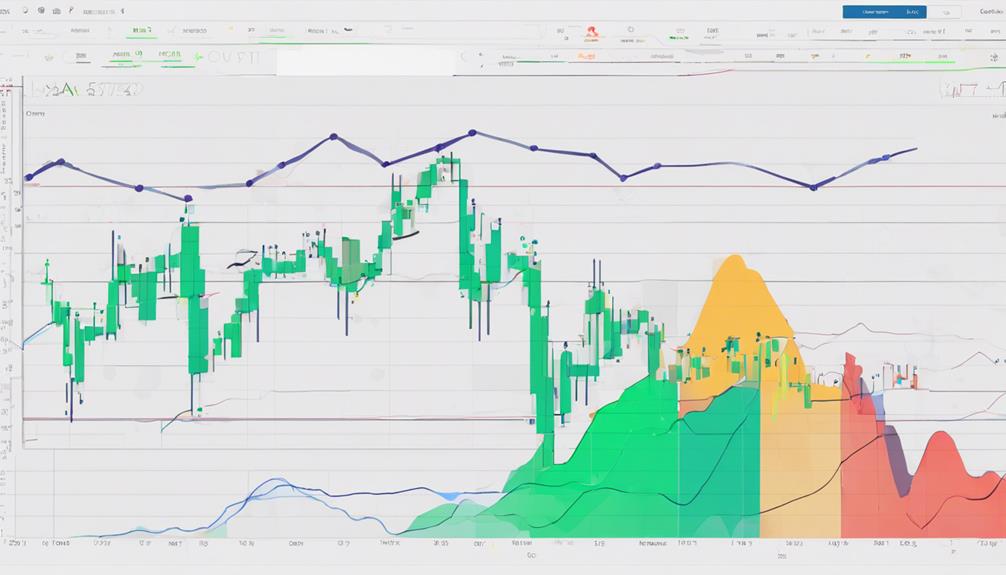
To maximize profits using the Ichimoku Cloud strategy, traders leverage key components like the Tenkan-Sen and Kijun-Sen lines for precise trade signals. The Tenkan-Sen crossing above the Kijun-Sen line generates a bullish signal, indicating a potential buying opportunity.
Additionally, traders watch for the Chikou Span breaking above the cloud as a strong buy signal, signaling a shift in momentum. Analyzing the cloud's color and position relative to the price chart is crucial for determining trend direction, aiding traders in making informed trading decisions.
Whether engaging in day trading or swing trading, understanding and utilizing these components of the Ichimoku Cloud indicator can enhance your ability to maximize profits and capitalize on market opportunities effectively.
Can You Explain the Ichimoku Cloud Indicator in a Simplified Way?
The understanding Ichimoku cloud indicator is a popular technical analysis tool used in the stock market. It provides valuable information about support and resistance levels, trend direction, and potential buy or sell signals. By using multiple lines and a cloud, it helps traders make informed decisions about market trends.
Frequently Asked Questions
What Is the Best Indicator for Ichimoku Cloud?
For the Ichimoku Cloud, the best indicator is subjective based on your trading strategy. The Tenkan-Sen and Kijun-Sen lines provide entry signals, while the Chikou Span confirms trends. Senkou Span A and B offer support and resistance levels. Master these for optimal trading decisions.
What Is the Basic Ichimoku Strategy?
To understand the basic Ichimoku strategy, focus on the Tenkan-sen and Kijun-sen lines for trend identification. Look for crossovers to spot potential buy or sell opportunities. Confirm trends by examining price in relation to the Cloud.
How Do You Use Ichimoku Indicator?
To use the Ichimoku indicator effectively, you must understand its components. These elements, like the Conversion Line and Cloud, offer insights into trends and support/resistance levels. By analyzing price in relation to these factors, you can make informed trading decisions.
What Are the 5 Lines of the Ichimoku Cloud?
To understand the Ichimoku Cloud, focus on its 5 lines: Tenkan-Sen, Kijun-Sen, Chikou Span, Senkou Span A, and Senkou Span B. Each line plays a crucial role in analyzing market trends and potential entry/exit points.
Conclusion
In conclusion, mastering the Ichimoku Cloud Indicator can be the key to unlocking profitable trading opportunities.
By delving into the intricacies of its components and signals, traders can navigate the markets with confidence and precision.
Remember, 'the proof is in the pudding' when it comes to implementing this powerful tool in your trading strategy.
Stay diligent, stay informed, and watch your profits soar with the Ichimoku Cloud at your side.