
Mastering the Average Directional Index (ADX) involves grasping intricate details and implementing strategic approaches. From comprehending directional movement to incorporating +DI and -DI indicators, each step plays a vital role in interpreting market trends effectively.
However, the journey to ADX proficiency doesn't end there. By exploring the significance of choosing the right timeframe, harmonizing ADX with additional indicators, and implementing prudent stop-loss strategies, traders can elevate their analytical skills and make more informed decisions.
Each tip offers a unique perspective, setting the stage for a deeper understanding of how to navigate the complexities of the ADX indicator.
Importance of Understanding ADX
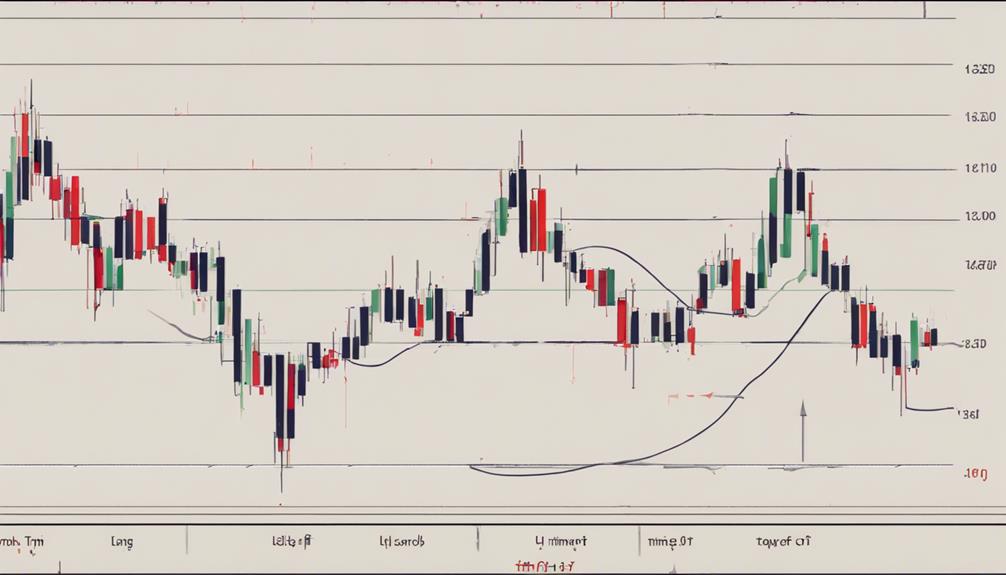
Understanding the Average Directional Index (ADX) is paramount for traders and investors seeking to gauge market trends effectively and anticipate potential reversals. The ADX indicator measures the strength of a trend on a scale of 0 to 100. Levels below 20 typically suggest a weak trend, while values above 40 indicate a strong trend.
By analyzing the ADX values, market participants can assess the intensity of price movements and potential changes in trend direction. However, it is crucial to note that using the ADX in isolation may not provide a complete picture. It is recommended to combine the ADX with other technical indicators to enhance the accuracy of trend analysis and confirm entry or exit points.
Incorporating the ADX indicator into trading strategies allows for a more comprehensive evaluation of trend strength and momentum. By utilizing the ADX as a risk management tool, traders can make well-informed decisions based on data rather than emotions, leading to potentially more successful trading outcomes.
Choosing the Right Timeframe
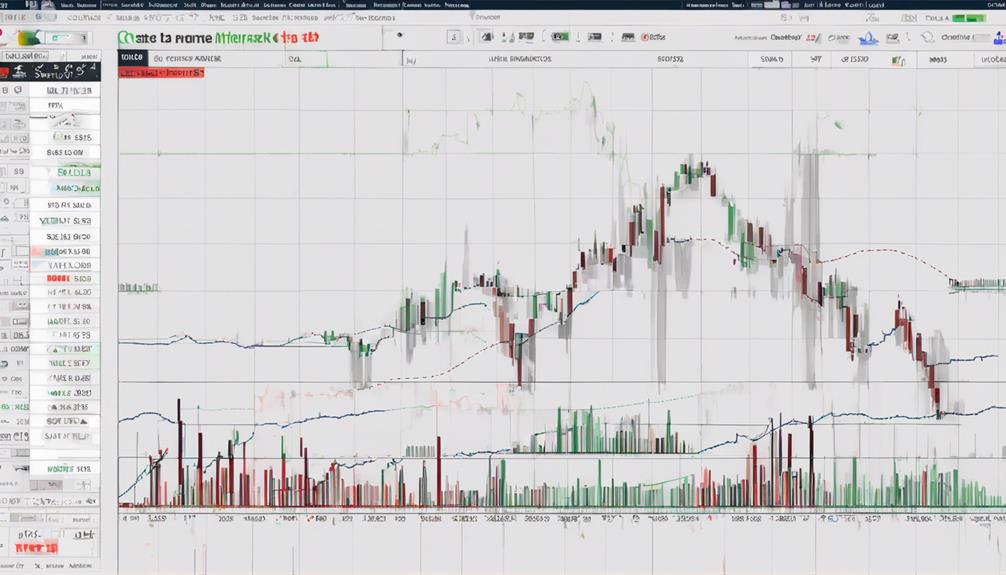
Selecting the appropriate timeframe for Average Directional Index (ADX) analysis is crucial for optimizing the accuracy and reliability of trend signals. The Average Directional Index (ADX) is particularly effective when applied on higher timeframes such as H1 or D1 for trend analysis.
Choosing the right timeframe plays a significant role in enhancing the quality of signals provided by the ADX indicator. Shorter timeframes tend to yield more volatile ADX readings, potentially leading to false signals due to increased market noise. Conversely, longer timeframes offer a broader perspective on the trend, reducing the impact of short-term fluctuations.
It is essential to align the timeframe for ADX analysis with your trading strategy and goals to ensure the optimal utilization of this indicator. By selecting the timeframe that best suits your trading style, you can improve the effectiveness of trend analysis and make more informed trading decisions based on the signals provided by the Average Directional Index (ADX).
Utilizing ADX With Other Indicators
Combining Average Directional Index (ADX) with indicators like Relative Strength Index (RSI) can provide a more robust confirmation of market trends.
Additionally, incorporating ADX with Moving Average Convergence Divergence (MACD) can offer enhanced insights into market momentum.
Furthermore, utilizing ADX in conjunction with Bollinger Bands can help traders pinpoint potential breakout points with greater accuracy.
ADX and RSI
When integrating the Average Directional Index (ADX) with the Relative Strength Index (RSI), traders gain a comprehensive perspective on market trends and momentum.
- ADX and RSI together offer insights into both trend strength and potential reversal points.
- RSI identifies overbought or oversold conditions, complementing ADX's trend strength indications.
- This combination leads to more precise entry and exit signals for trading positions.
- By utilizing ADX and RSI in tandem, traders can improve decision-making, manage risks effectively, and enhance trading outcomes.
The synergy between ADX and RSI enhances traders' ability to interpret market conditions accurately, empowering them to make better-informed trading choices and optimize their strategies for success.
ADX and MACD
Integrating the Average Directional Index (ADX) with the Moving Average Convergence Divergence (MACD) provides traders with a robust framework for analyzing market trends and momentum shifts. While ADX measures the strength of a trend through the Directional Movement System, MACD focuses on momentum and trend reversals.
By combining these indicators, traders can gain a more comprehensive view of market conditions, enhancing their ADX Trading strategies. Many traders use ADX to confirm signals generated by MACD, increasing confidence in their trading decisions.
Understanding how ADX and MACD work together can improve trend analysis and help traders identify potential entry and exit points more effectively. By leveraging the strengths of both indicators, traders can refine their trading approach and make informed decisions.
ADX and Bollinger Bands
How can the utilization of the Average Directional Index (ADX) with Bollinger Bands enhance trading strategies and provide additional confirmation signals? The synergy between these two indicators can significantly improve trade decisions by combining trend strength analysis with volatility identification. Here's how it works:
- Confirmation Signals: Bollinger Bands help identify potential price breakouts, while ADX confirms strong trends when prices move outside the bands.
- Trend Strength Analysis: ADX provides insight into the strength of a trend, complementing Bollinger Bands' volatility analysis.
- Risk Management Improvement: By filtering out false signals, the combination enhances risk management and focuses on robust trend opportunities.
- Comprehensive Market Analysis: Utilizing ADX with Bollinger Bands offers a holistic approach to analyzing market trends and determining optimal entry/exit points.
Setting Realistic Expectations
Establishing realistic expectations is crucial when utilizing the Average Directional Index (ADX) as it provides insight into the strength of trends rather than the direction itself. ADX is a trend strength indicator, not a directional one.
Recognizing that ADX values below 20 indicate weak trends is essential. Traders should set clear goals when using ADX to effectively manage trading decisions.
Moreover, understanding that ADX values above 40 suggest strong trends can help traders identify potential trading opportunities. It is imperative to adjust trading strategies based on the trend strength indicated by the ADX values.
Implementing Effective Stop Loss Strategies
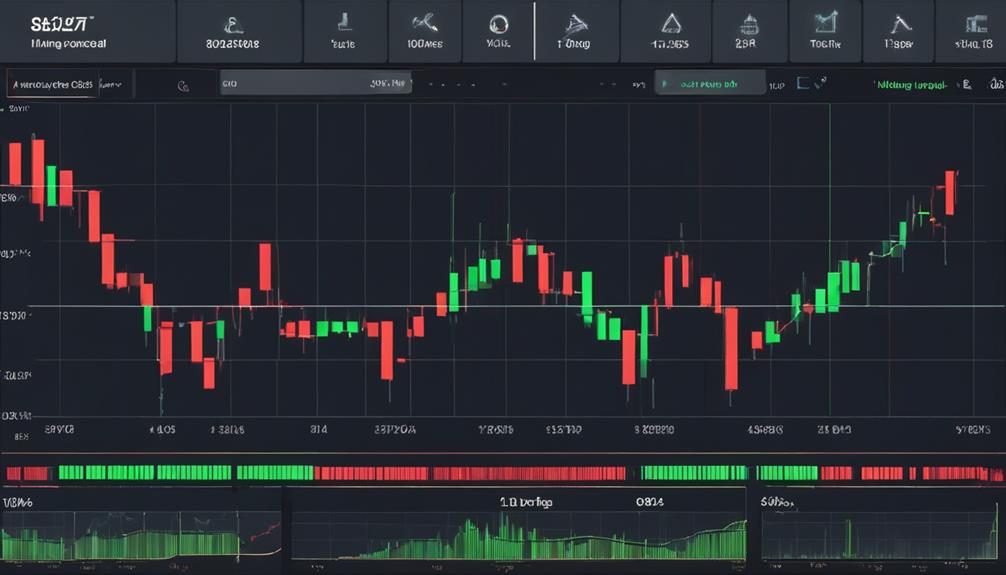
Recognizing the importance of setting stop-loss orders based on ADX levels is fundamental in safeguarding against potential losses and optimizing risk management strategies in trading scenarios. When implementing effective stop-loss strategies using the Average Directional Index (ADX), traders can enhance their decision-making process. Here are key points to consider:
- Utilize ADX Levels: Determine the trend strength using ADX readings to set appropriate stop-loss orders.
- Trailing Stop-Loss: Implement trailing stop-loss strategies that adjust based on ADX levels to maximize profits while protecting against major reversals.
- Integration with Technical Indicators: Combine ADX with other technical indicators to validate and reinforce stop-loss placement for trades.
- Regular Review and Adjustment: Continuously monitor ADX signals and adjust stop-loss levels accordingly to manage risk effectively and adapt to changing market conditions.
Monitoring ADX Trends Regularly
Monitoring ADX trends regularly is essential for traders seeking to gauge market direction and trend strength accurately. By tracking ADX movements consistently and analyzing trend changes, traders can identify shifts in buying or selling pressure, potential trend reversals, and optimal entry/exit points.
This data-driven approach enables traders to make informed decisions, manage risks effectively, and validate signals from other indicators, steering clear of impulsive trading actions.
Track ADX Movements Consistently
Consistently tracking the Average Directional Index (ADX) allows traders to gauge the strength of price movements effectively. To ensure you stay on top of ADX movements, consider the following:
- Set up regular ADX trend analysis sessions to monitor changes over time.
- Utilize ADX values above 25 as an indication of increasing trend strength.
- Watch for falling ADX values, signaling potential weakening trend momentum.
- Use ADX movements to validate trend reversals or continuation patterns.
Analyze ADX Trend Changes
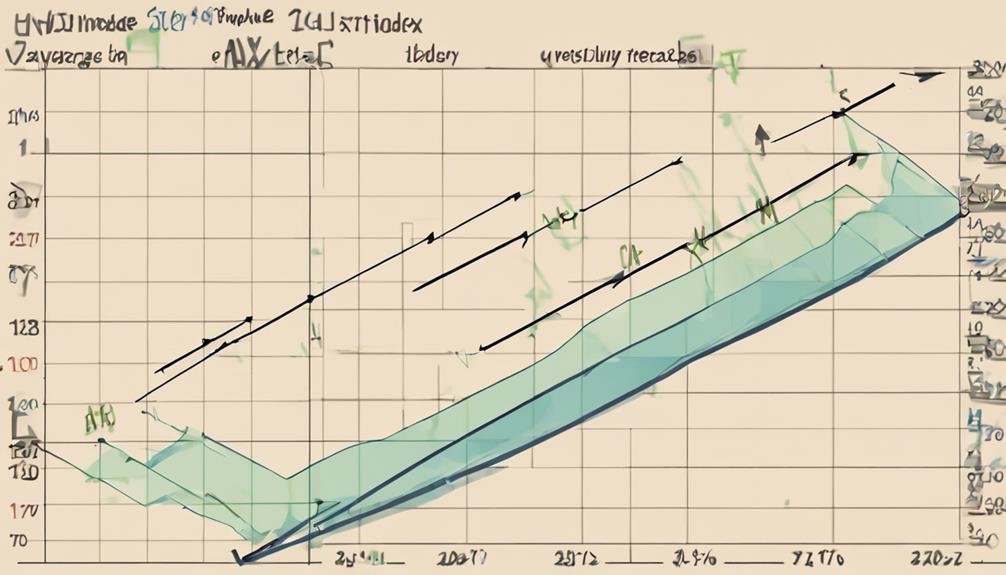
To effectively assess market trends and potential shifts in momentum, diligent observation of ADX values above 25 is crucial for traders seeking to optimize their strategies. Monitoring ADX trend changes regularly allows traders to spot potential shifts in market dynamics.
Rising ADX values suggest increasing trend strength, indicating a robust market trend. Conversely, decreasing ADX values may signal a weakening trend, prompting traders to reevaluate their positions. By analyzing ADX trend changes, traders can adapt their trading strategies accordingly, ensuring they align with the evolving market conditions.
Staying attuned to these fluctuations in ADX values provides valuable insights into the market's behavior, enabling traders to make informed decisions based on data-driven observations.
Continuous Learning and Improvement

In the pursuit of mastering the Average Directional Index (ADX), a commitment to continuous learning and improvement is essential. To excel in utilizing this technical indicator for determining trend direction, consider the following strategies:
- Regular Practice: Engage consistently in ADX calculations to enhance proficiency and accuracy.
- Online Resources: Utilize tutorials and materials available online to deepen comprehension of ADX concepts.
- Community Engagement: Join forums or communities to exchange ADX strategies, gaining insights from diverse perspectives.
- Historical Analysis: Review past ADX charts and data to recognize patterns and trends, facilitating ongoing improvement efforts.
Can I Excel in Using the Average Directional Index With Your Essential Tips?
Yes, anyone can excel in using the average directional index definition with the right tips. Understanding its calculation method, interpreting its values, and combining it with other indicators can lead to successful trading decisions. With practice and observation, you can leverage the ADX to identify and capitalize on market trends.
Frequently Asked Questions
What Are the Best Settings for the Average Directional Index?
The best settings for the Average Directional Index (ADX) are typically a 14-day period, offering a balanced view of trend strength and aiding in identifying reversals. Common ADX thresholds of 20 or 25 differentiate between weak and strong trends, with adjustments tailored to specific trading strategies and timeframes.
How Do You Calculate Average Directional Index in Excel?
To calculate the Average Directional Index (ADX) in Excel, employ EMA-based formulas for the +DI and -DI, determine True Range (TR) for price movement, and compute ADX by finding the EMA of DI differences.
Which Indicator Works Best With Adx?
When analyzing trends, combining the Average Directional Index (ADX) with the Relative Strength Index (RSI) enhances trend confirmation. The Moving Average Convergence Divergence (MACD) indicator complements ADX by offering insights into momentum and trend strength.
What Is the Best Time Frame for Adx?
The best time frame for ADX is typically higher timeframes like H1 or D1, providing more reliable trend signals. ADX is most effective on trending price movements, making it suitable for longer timeframes.
Conclusion
In the world of trading, mastering the Average Directional Index (ADX) is essential for making informed decisions. By understanding market dynamics, utilizing indicators effectively, and monitoring trends regularly, traders can enhance their analysis and improve their trading strategies.
Just as a skilled sailor navigates the unpredictable seas with precision and foresight, mastering the ADX can help traders navigate the volatile markets with confidence and success.