
The integration of the On-Balance-Volume (OBV) indicator within stock market analysis provides a nuanced understanding of market sentiments and potential price movements. As a tool that emphasizes volume trends, OBV offers unique insights that complement traditional technical indicators.
Delving into the intricacies of how OBV interacts with price action and market momentum can unlock new dimensions in trading strategies. Understanding the mechanics of OBV, its implications, and its role within the broader spectrum of market analysis can prove to be a valuable asset for investors seeking to enhance their decision-making processes.
How OBV Indicator Works
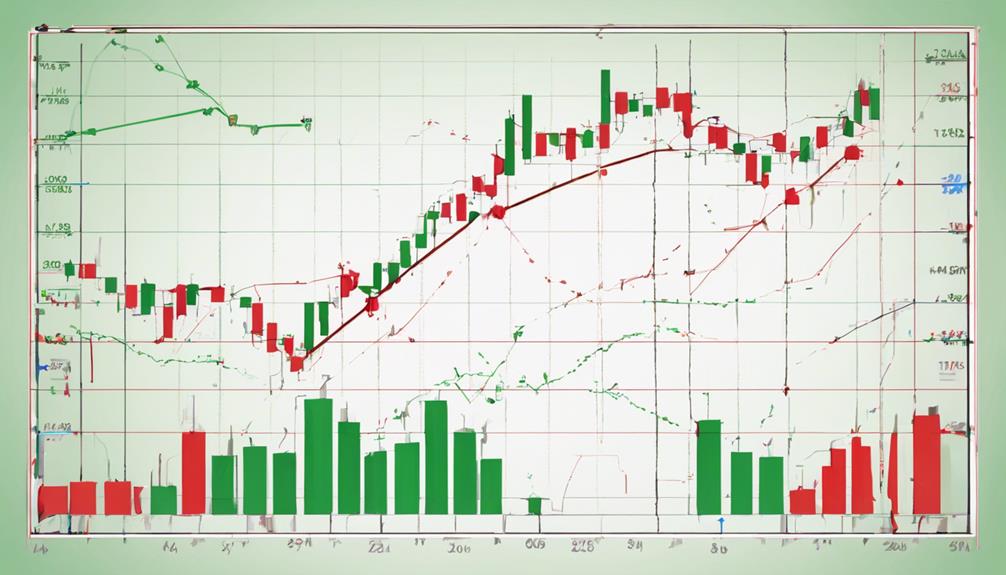
The OBV indicator functions as a dynamic tool in stock market analysis, integrating volume and price data to evaluate the strength and direction of market trends. Trading volume is a crucial aspect of market analysis, and the OBV indicator takes this into account by assigning a positive or negative value to the cumulative volume based on the price movement.
This indicator assists traders in determining whether volume is flowing in or out of a security, providing insights into market sentiment. By utilizing a simple moving average of the OBV line, traders can identify trends and potential trend reversals.
The OBV indicator, a popular Technical Analysis tool, helps traders confirm the strength of a price move and spot potential buying or selling opportunities. Understanding how the OBV indicator works is essential for traders looking to make informed decisions based on both volume and price movements in the market.
Significance of OBV in Analysis

Examining the role of OBV in market analysis reveals its critical function in evaluating trend strength and market sentiment. The OBV indicator, by combining price movements and volume, provides insights into market trends and sentiment.
A rising OBV line indicates bullish sentiment and potential price increases, while a falling OBV line suggests bearish sentiment and possible price declines. Moreover, divergences between OBV and price trends can signal upcoming price reversals, offering traders valuable information for making informed decisions.
OBV not only confirms overall market trends but also helps identify the control of market momentum. When OBV is rising, it signifies accumulation and an uptrend in the market, whereas a declining OBV indicates distribution and a downtrend.
Using OBV for Trading Decisions
Utilizing On-Balance Volume (OBV) as a key indicator in trading decisions enhances market analysis by providing a comprehensive view of trend conviction based on price movement and volume dynamics. OBV serves as a valuable tool in identifying potential trend reversals, offering insights into market sentiment through its divergence from price action.
Divergences between OBV and price trends can act as a signal for upcoming price reversals, aiding traders in making informed decisions. Increasing OBV confirms an uptrend, indicating buyer accumulation and supporting bullish market sentiment. Conversely, decreasing OBV suggests a downtrend, reflecting distribution and bearish sentiment.
Advanced Analysis Techniques
Exploring advanced techniques in OBV analysis unveils strategic methodologies for precise market forecasting and informed trading decisions. By focusing on breakout and breakdown patterns, traders can anticipate market movements more accurately. Comparing OBV trends across various securities enhances the reliability of trading signals, providing a broader perspective on market dynamics. Integrating momentum oscillators with OBV can further refine market trend forecasts, offering insights into potential buying or selling opportunities.
A breakout in OBV signifies strong buying pressure, indicating possible upward trends in stock prices. However, it is essential to acknowledge the risks and limitations associated with OBV analysis to effectively manage trading strategies. Understanding these factors is crucial for mitigating potential losses and optimizing trading outcomes. By leveraging advanced analysis techniques, traders can harness the power of OBV to make well-informed decisions in the dynamic stock market environment.
Case Studies and Performance
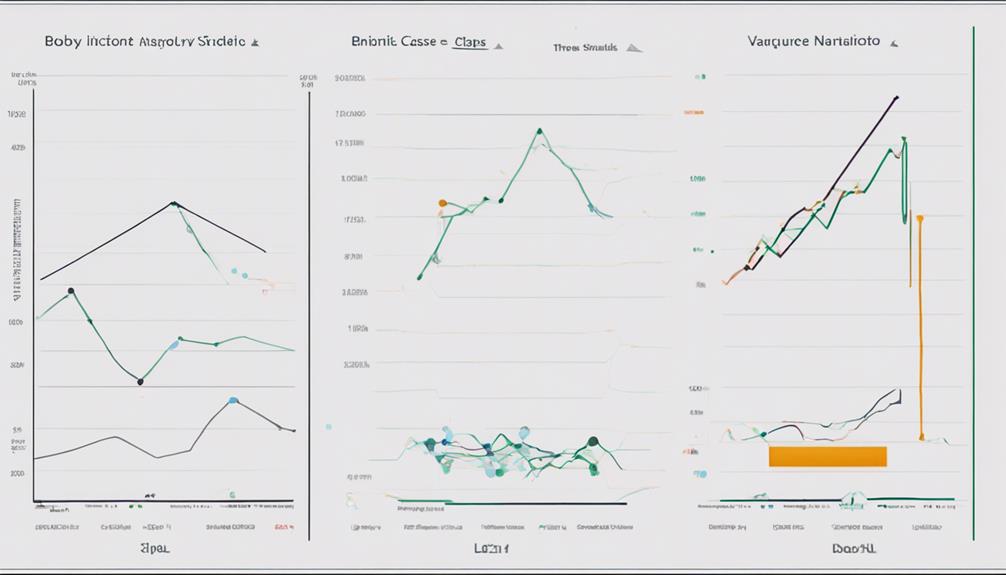
Investigating real-world applications and outcomes of the OBV indicator provides valuable insights into its effectiveness in guiding stock market decisions and performance analysis.
The On-Balance Volume (OBV) indicator plays a crucial role in identifying market trends and potential trend reversals. A rising OBV confirms uptrends and signals buyer accumulation, indicating a bullish market sentiment. Conversely, a decreasing OBV suggests downtrends and distribution, reflecting a bearish outlook.
By analyzing volume flow and market trend conviction, traders can anticipate shifts in market momentum and overall trend strength. OBV buy and sell signals offer guidance on optimal entry and exit points based on volume dynamics, enhancing trading strategies.
Through case studies, traders can observe how OBV assists in confirming trends, spotting reversals, and improving market timing, ultimately contributing to more informed decision-making and potentially better performance in the stock market.
Is OBV Indicator Effective for Analyzing Bearish Market Trends as Well?
When it comes to understanding OBV indicator bullish market, many traders wonder if it is effective for analyzing bearish market trends as well. The OBV indicator can be a useful tool for identifying bearish trends, as it measures buying and selling pressure to anticipate potential trend reversals.
Frequently Asked Questions
Which Is the Most Successful Stock Indicator?
In the realm of stock market analysis, the most successful indicator is subjective and varies based on individual trading strategies and objectives. Popular indicators like OBV offer valuable insights, yet success ultimately hinges on trader proficiency and market conditions.
What Is the Best Time Frame for OBV Indicator?
The best time frame for the OBV indicator varies based on the trading style and investment horizon. Shorter periods like 14 or 21 days suit intraday trading, while longer spans such as 50 or 200 days are preferred for swing trading and investing. Adjusting the time frame provides different insights.
Is OBV a Leading Indicator?
Indeed, the On-Balance Volume (OBV) is considered a leading indicator in stock market analysis. By analyzing volume flow dynamics, OBV can forecast potential price movements, aiding traders in decision-making processes for both reversals and trend continuations.
Which Indicator Has Highest Accuracy?
In evaluating indicators for accuracy in stock market analysis, it is essential to consider various factors such as historical performance, consistency, and relevance to current market conditions. Conducting a comparative analysis based on these criteria can determine the indicator with the highest accuracy.
Conclusion
In conclusion, the On-Balance-Volume (OBV) indicator is a valuable tool for analyzing stock market trends and momentum. By summing up volume on up days and subtracting volume on down days, OBV provides insights into market conviction.
One interesting statistic to note is that studies have shown that incorporating OBV alongside other technical indicators can improve trading decisions and increase profitability.
It is crucial for traders to understand and utilize the OBV indicator to make informed trading decisions.