
Elliott Wave Theory offers traders a structured approach to analyzing market trends and potential price movements. The five best insights into this theory provide a deeper understanding of how wave patterns can be utilized to forecast market behavior.
From identifying impulse waves to navigating corrective waves, each insight offers a unique perspective on market dynamics. By exploring these key takeaways, traders can enhance their technical analysis skills and potentially gain an edge in the ever-changing financial markets.
Understanding the nuances of Elliott Wave Theory could be the key to unlocking profitable trading strategies.
Key Takeaways on Elliott Wave Theory
Arguably the most notable feature of Elliott Wave Theory is its emphasis on identifying and analyzing the distinct five-wave patterns that characterize market trends. These patterns consist of impulse waves that drive the trend in the direction of the primary market movement and corrective waves that provide temporary retracements against the trend. By understanding the Elliott Wave Pattern, traders can gain valuable insights into the market dynamics and anticipate potential price movements.
In trading, the integration of Fibonacci ratios with Elliott Wave Theory is a common practice among analysts. The Fibonacci levels act as crucial tools for traders to identify potential reversal and continuation points in price movements, enhancing the accuracy of their market analysis. Additionally, wave analysis techniques enable traders to pinpoint support levels, evaluate trend strength, and set price targets by examining wave patterns and extensions meticulously.
To effectively utilize Elliott Wave Theory in trading, it is essential for traders to implement proper wave confirmation techniques and robust risk management strategies. By adhering to these principles, traders can make informed decisions based on sound analysis and increase their chances of success in the market.
Elliott Wave Principle Explained

The Elliott Wave Principle is a technical analysis tool that identifies distinct patterns consisting of impulse and corrective waves in a five-wave structure. This principle plays a crucial role in understanding market direction and potential entry/exit points for traders.
Here are key aspects to consider:
- Wave Structure: The Elliott Wave Principle categorizes waves into impulse waves (1, 3, 5) that move with the trend and corrective waves (2, 4) that retrace the price movement.
- Analysis Tools: Correctly identifying wave counts and understanding wave characteristics are essential for effectively applying the Elliott Wave Principle to market analysis.
- Enhanced Analysis: Traders can combine the Elliott Wave Principle with Fibonacci ratios and various technical indicators to enhance the accuracy of their market forecasts and trading decisions.
Understanding Elliott Wave Patterns
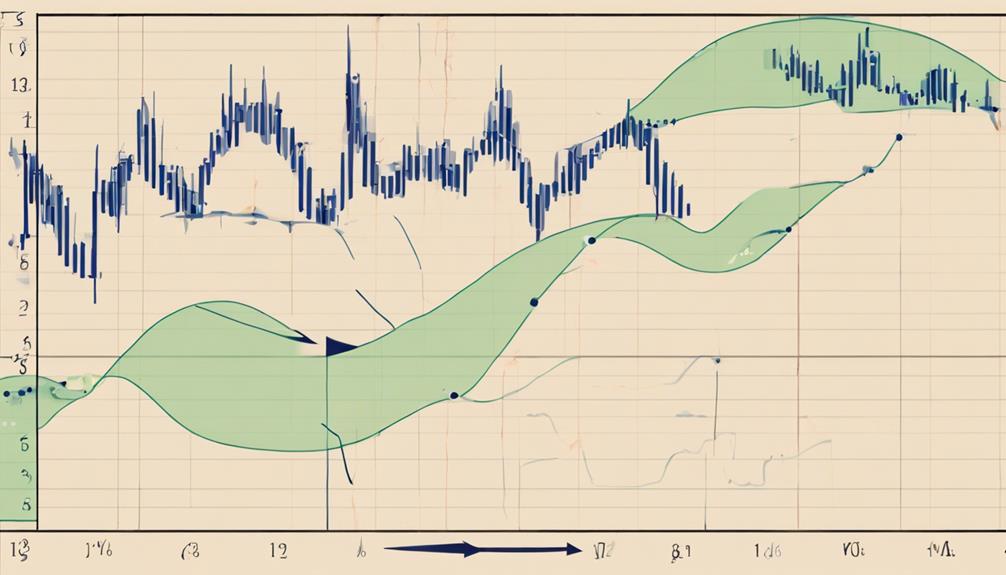
Identifying repetitive wave patterns in financial markets, Elliott Wave Theory provides traders with a structured framework for analyzing market movements and predicting future price trends. These patterns consist of impulse waves, denoted as 1, 3, 5, which move with the overall trend, and corrective waves, labeled as 2, 4, which move against the trend.
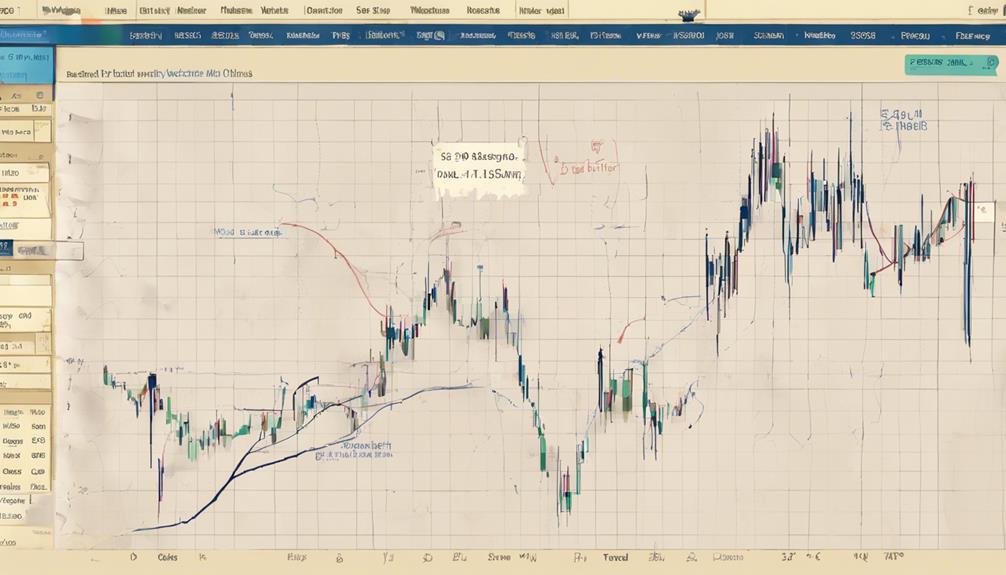
Understanding these patterns is crucial as they offer insights into potential future price movements. By utilizing technical analysis methods and tools such as the Fibonacci retracement tool, traders can determine the wave count within a larger cycle and make informed decisions regarding market positions.
Recognizing the interplay between impulse and corrective waves aids in effective risk management strategies, allowing traders to better navigate market volatility. By studying Elliott Wave patterns, traders gain a deeper understanding of how market prices move in repetitive cycles, enhancing their ability to forecast and capitalize on future price trends.
Practical Applications of Elliott Waves
An essential aspect of utilizing Elliott Wave Theory in trading strategies involves discerning the practical applications of identifying impulse and corrective waves to anticipate market trend reversals.
When it comes to practical applications of Elliott Waves, traders focus on:
- Entry and Exit Points: Traders use Elliott Waves to pinpoint optimal entry and exit points in the market, leveraging wave patterns and Fibonacci ratios for strategic decision-making.
- Wave Characteristics: Understanding the characteristics of different waves, such as Wave 3 being the strongest and Wave 5 marking the final move, is crucial for traders to interpret market movements accurately.
- Integration with Technical Indicators: Combining Elliott Wave Theory with other technical indicators enhances the precision of market analysis and trading strategies, providing traders with a more comprehensive view of potential market movements and trends.
Evaluating Elliott Wave Theory's Reliability
With an inherent accuracy rate akin to chance, evaluating the reliability of Elliott Wave Theory proves to be a meticulous undertaking in the realm of market analysis and trading strategies.
The subjective nature of Elliott Wave Theory poses challenges in backtesting and interpreting market movements accurately. Traders often find it beneficial to combine this technical analysis tool with other indicators to enhance the reliability of their predictions.
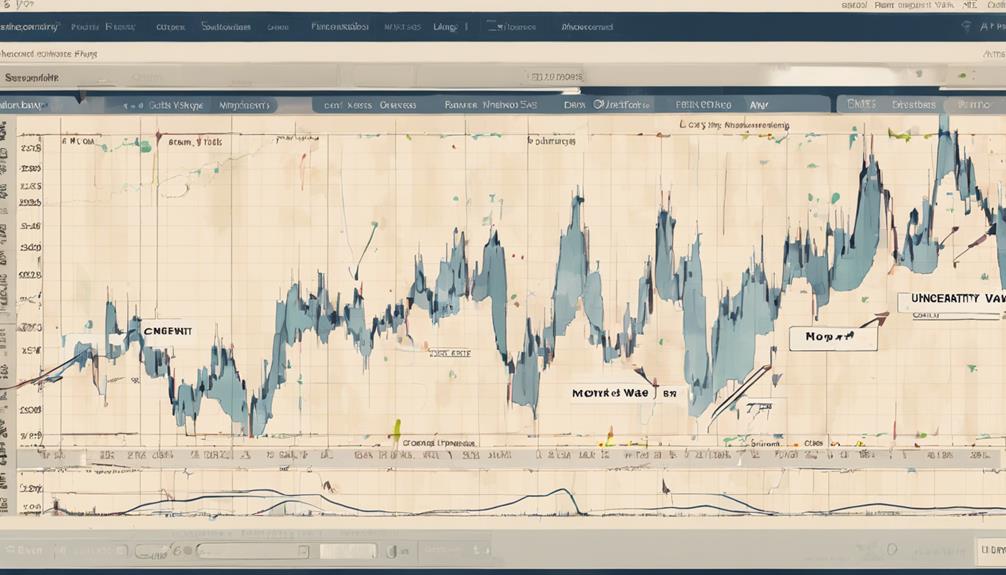
Market conditions, liquidity, and the correct identification of wave patterns play crucial roles in determining the theory's effectiveness. While the theory offers insights into potential support and resistance levels, its limitations in adaptability and susceptibility to subjective interpretation underscore the necessity of a comprehensive trading strategy that integrates Elliott Wave analysis with other tools.
Understanding the complexities and reliability challenges associated with Elliott Wave Theory is essential for traders aiming to make informed decisions in the dynamic landscape of financial markets.
How Can I Apply Elliott Wave Theory in Practical Situations?
When applying practical insights Elliott Wave Theory, traders can use the wave patterns to identify potential future price movements in financial markets. By understanding the psychological factors driving market behavior, individuals can make more informed decisions and capitalize on trading opportunities.
Frequently Asked Questions
What Is the Best Indicator for Elliott Wave?
The Fibonacci retracement tool stands out as a premier indicator for Elliott Wave Theory. It aids in pinpointing critical support and resistance levels, aligning with the theory's principles. Traders leverage Fibonacci ratios to enhance wave count accuracy and predict price reversals effectively.
What Are the 3 Golden Rules of Elliott Wave?
The three golden rules of Elliott Wave Theory are: Wave 2 cannot retrace over 100% of Wave 1, Wave 3 should not be the shortest impulse wave, and Wave 4 must not overlap with Wave 1's price territory.
What Is the Best Software for Elliott Wave Analysis?
In the realm of Elliott Wave analysis, MotiveWave, WaveBasis, Sierra Chart, NinjaTrader, and MetaStock stand as pillars, offering sophisticated tools for wave counting and pattern recognition. Each software provides a unique blend of features to aid traders and analysts.
What Is the Success Rate of Elliott Wave Theory?
The success rate of Elliott Wave Theory, estimated at approximately 50%, hinges on various factors like market liquidity and wave identification accuracy. To enhance reliability, traders should complement it with other technical tools.
Conclusion
In conclusion, Elliott Wave Theory offers valuable insights into predicting market movements through the identification of recurring wave patterns. By understanding these patterns, traders can anticipate price movements, identify entry and exit points, and gain a unique perspective on market psychology.
Despite being a subjective tool, the theory remains a valuable asset for experienced technical analysts. Its application in financial markets provides a structured approach to analyzing trends and making informed trading decisions.