
You might not be aware that the Ichimoku Cloud Indicator is more than just a simple trend-following tool; it encompasses multiple elements that can provide you with a holistic view of the market dynamics.
Understanding how each component interacts could significantly enhance your trading decisions.
By breaking down the Ichimoku Cloud into its key components and learning how to interpret its signals, you'll be equipped with a powerful tool to navigate the complex world of trading.
Stay tuned to uncover the simplicity behind this advanced indicator and how it can potentially elevate your trading strategies.
Understanding Ichimoku Cloud Components
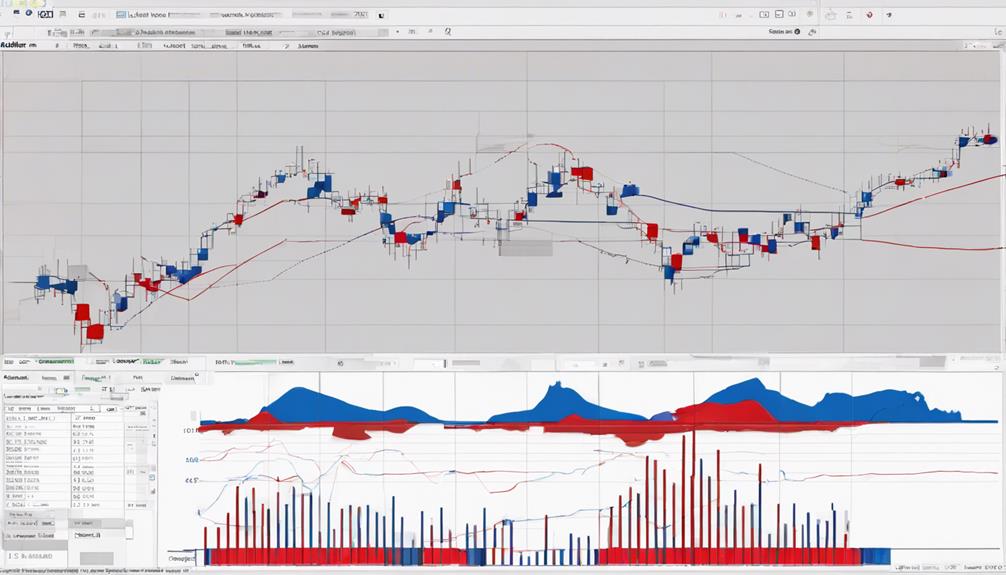
To grasp the essence of the Ichimoku Cloud indicator, delve into the intricate web of its components that include the Tenkan-Sen, Kijun-Sen, Chikou Span, Senkou Span A, and Senkou Span B.
The Tenkan-Sen, represented by the blue line, calculates the average price highs and lows over the last 9 periods.
On the other hand, the Kijun-Sen, denoted by the red line, highlights the midpoint of the last 26 periods to aid in spotting potential trend reversals.
The Chikou Span serves as the lagging line, confirming trend signals by comparing current price levels to historical ones.
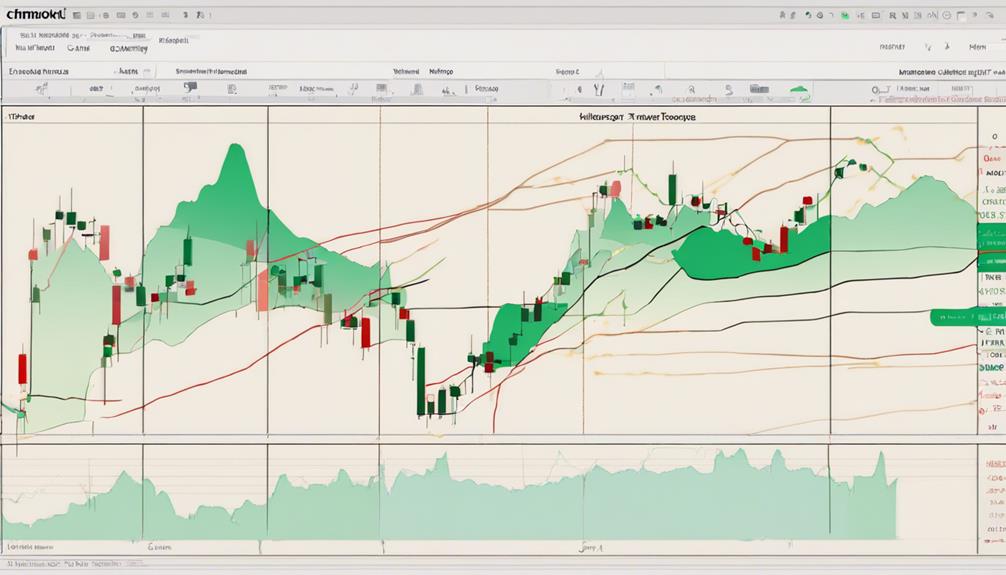
Additionally, Senkou Span A and Senkou Span B form the colored cloud, with Span A positioned midway between Tenkan-Sen and Kijun-Sen, and Span B situated at the midpoint of the last 52 price bars.
Interpreting Conversion and Base Lines
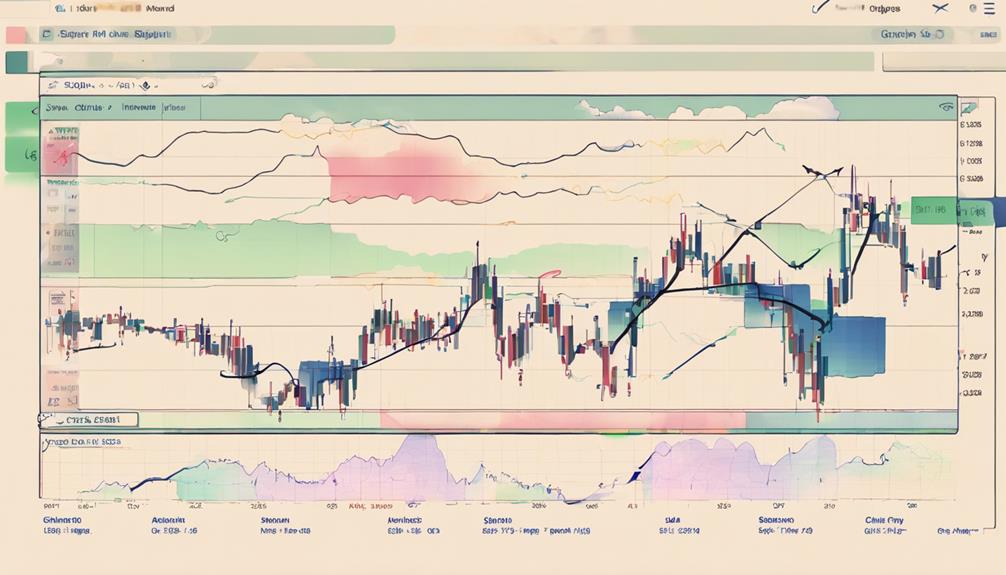
Interpreting the Conversion and Base lines in the Ichimoku Cloud involves analyzing their dynamic support and resistance roles, which are pivotal in identifying potential trend reversals and momentum shifts.
The Conversion line, derived from the average of the 9-period high and low, and the Base line, calculated from the 26-period high and low averages, act as significant indicators. These lines serve as dynamic support or resistance levels during price movements.
Crosses between the Conversion and Base lines can signal changes in momentum and potential trend reversals. Traders often interpret the Conversion line crossing above the Base line as a bullish signal, indicating a potential uptrend, while the opposite scenario may suggest a bearish signal, signaling a possible downtrend.
Understanding these elements is crucial for making informed trading decisions.
Decoding Ichimoku Cloud Signals
Deciphering the signals generated by the Ichimoku Cloud involves understanding the various components and their interactions to gain insights into potential market trends and reversals. Here are key points to consider:
- Tenkan-Sen: Represents the short-term average calculated over the past 9 periods.
- Kijun-Sen: Reflects the medium-term midpoint calculated over the past 26 periods.
- Chikou Span: Lags behind the current price by 26 periods, confirming trend signals.
Utilizing Ichimoku Indicator for Trading
When utilizing the Ichimoku Indicator for trading, understanding the key components like the Conversion and Base lines is crucial. These lines, forming the Cloud, offer insights into trend direction and momentum. Favorable buy trades typically occur when the price is above both lines, signaling bullish momentum.
Additionally, crosses of the Conversion and Base lines confirm momentum direction, with a bullish trend indicated by the shorter line crossing above the longer line. The Ichimoku Cloud also serves as a dynamic support and resistance level, aiding in identifying potential trade entry and exit points.
Combining Ichimoku with other indicators like RSI can further enhance trading signals and assist in recognizing possible reversals in the market.
Implementing Ichimoku Cloud Strategies
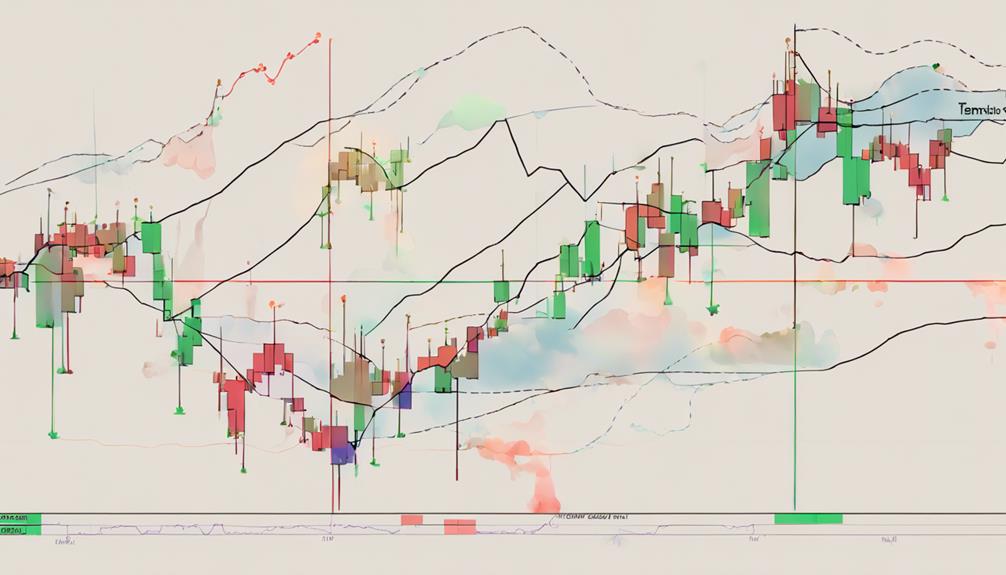
Implementing Ichimoku Cloud strategies involves integrating signals from key components such as the Tenkan-Sen and Kijun-Sen lines to optimize trading decisions. When using the Ichimoku cloud system for trade, consider the following strategies:
- Conversion Line Crosses: Identify potential entry and exit points based on the Conversion Line crossing above or below the Base Line.
- Chikou Span Confirmation: Use the Chikou Span to confirm trend signals generated by the crossover of the Tenkan-Sen and Kijun-Sen lines.
- Kumo Twist Trade Signal: Look for buy or sell opportunities when the price action breaks above or below the Kumo cloud.
Is the Walkthrough of the Ichimoku Cloud Indicator in Your Simplified Guide the Same as in the Simplified Guide: Ichimoku Cloud Indicator Walkthrough?
Yes, the Ichimoku Cloud Indicator Walkthrough in Your Simplified Guide is the same as in the Simplified Guide: Ichimoku Cloud Indicator Walkthrough. This comprehensive walkthrough covers all the essential aspects of the Ichimoku Cloud Indicator, making it easy for beginners to understand and apply it effectively in their trading strategies.
Frequently Asked Questions
What Is the Best Indicator for Ichimoku Cloud?
For Ichimoku Cloud, the best indicator is the Tenkan-Sen line. It's the Conversion Line, calculated from the midpoint of the last 9 candlesticks. It offers early trend signals, crossing with Kijun-Sen for bullish or bearish trends.
What Are the Drawbacks of Ichimoku?
Diving into the drawbacks of Ichimoku, remember its subjectivity and learning curve. Understand that it may not excel in all markets. Validate with additional tools for clarity. Varying interpretations exist, so supplement with comprehensive analysis.
How Accurate Is Ichimoku Cloud Indicator?
In trading, the accuracy of the Ichimoku Cloud indicator shines through its ability to offer multiple confirmations for trade signals. It stands out for its high degree of accuracy in trend identification, making it a valuable tool for traders.
Which Timeframe Is Best for Ichimoku?
For Ichimoku, choose timeframes based on your trading goals. Daily suits swing trading and long-term views, while 1-hour or 4-hour fits day trading. Weekly/monthly offer broader trends. Experiment with various timeframes to find what works best for you.
Conclusion
In conclusion, mastering the Ichimoku Cloud Indicator can unlock a world of trading opportunities. By understanding its components and signals, traders can confidently navigate the markets and make informed decisions.
Remember, the Ichimoku Cloud is like a guiding light in the stormy sea of trading, illuminating the path to potential profits. Embrace this powerful tool, and let it lead you to success in your trading journey.