
Standard deviation serves as a crucial gauge in technical analysis, shedding light on market volatility and price movements. Yet, what truly defines standard deviation as a technical indicator?
Beyond its mathematical roots, this metric delves deeper into the nuances of market behavior, offering insights into investor sentiment and potential trading opportunities. By understanding the intricacies of standard deviation, traders can unlock a wealth of information that goes beyond mere statistical calculations.
The true essence of standard deviation lies in its ability to decode the underlying dynamics of market trends and fluctuations, providing a foundation for informed decision-making in the realm of technical analysis.
Definition of Standard Deviation Indicator
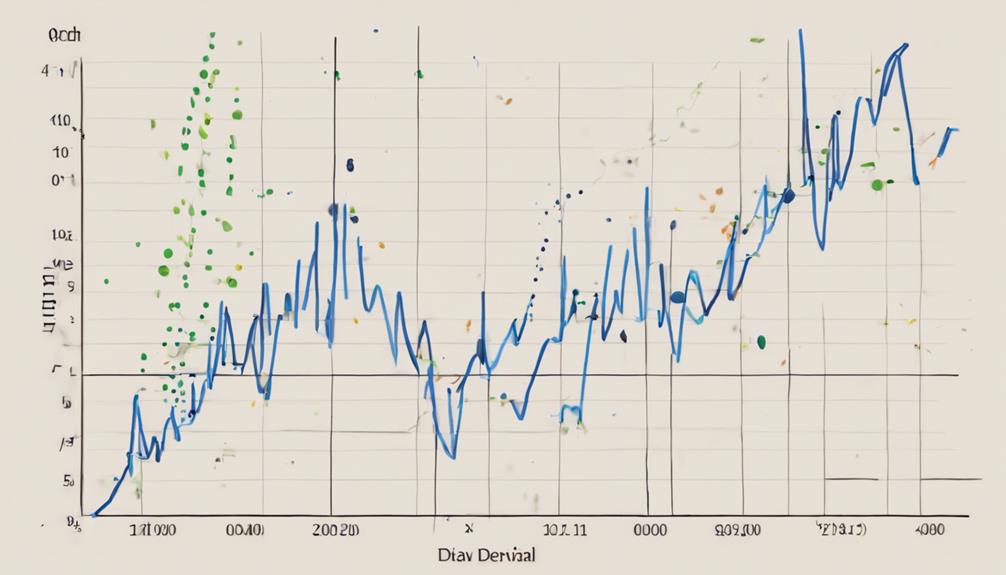
The Standard Deviation indicator, a fundamental tool in technical analysis, quantifies market volatility by measuring the dispersion of prices around the average price. In trading, understanding standard deviation is crucial as it provides insights into market behavior and potential price movements over different time periods.
High standard deviation values indicate that prices are spread out widely from the average, signaling increased market volatility. Conversely, low standard deviation suggests that prices are relatively stable and not deviating significantly from the average price.
Traders often use the Standard Deviation indicator in conjunction with other technical tools like Bollinger Bands to identify potential trend reversals or periods of heightened volatility. By adjusting the time periods, traders can customize the sensitivity of the indicator to suit their trading strategies and risk tolerance. This indicator, focusing solely on price dispersion, helps traders gauge the potential magnitude of price moves without indicating the direction of the trend.
Importance of Standard Deviation in Analysis
Essential in technical analysis, standard deviation plays a pivotal role in evaluating market volatility and price dispersion from the average. It is a crucial tool for understanding market behavior and making informed trading decisions.
Here are five key reasons why standard deviation is important in analysis:
- Standard deviation measures price volatility, helping traders identify potential price movements.
- It aids in setting realistic price targets and managing risk by showing price variability.
- Standard deviation is essential for confirming trends in the market.
- It provides insights into entry and exit opportunities for traders.
- Utilizing standard deviation enhances market stability analysis, aiding in risk management strategies.
Calculation and Interpretation of Standard Deviation
Calculation and Interpretation of Standard Deviation involves a detailed analysis of market volatility through mathematical computations and statistical interpretations.
In technical analysis, standard deviation is calculated by first finding the mean average of a set of data points. Then, the differences between each data point (such as closing prices) and the mean are squared, summed up, divided by the number of data points, and finally, the square root is taken. This process results in a numerical value that represents the degree of price variability within the dataset.
High standard deviation values indicate greater price dispersion and market volatility, suggesting wider fluctuations in prices and a broader trading range. Conversely, lower standard deviation values imply more stable prices and a narrower trading range.
Traders use standard deviation to assess historical volatility, predict potential price movements, set realistic price targets, and make informed trading decisions. Furthermore, standard deviation is a vital tool for risk management in trading, enabling traders to calculate risk versus return, adjust position sizes based on volatility, and enhance trading strategies by considering price variability.
Application of Standard Deviation in Technical Analysis
Analyzing market volatility through the application of standard deviation in technical analysis provides traders with valuable insights into price dispersion and potential price movements.
- Standard deviation in technical analysis helps in measuring market volatility by assessing price dispersion from the average.
- Traders can understand the level of price fluctuation and use this information to predict potential price movements.
- It aids in making informed decisions regarding risk management and determining optimal entry/exit points.
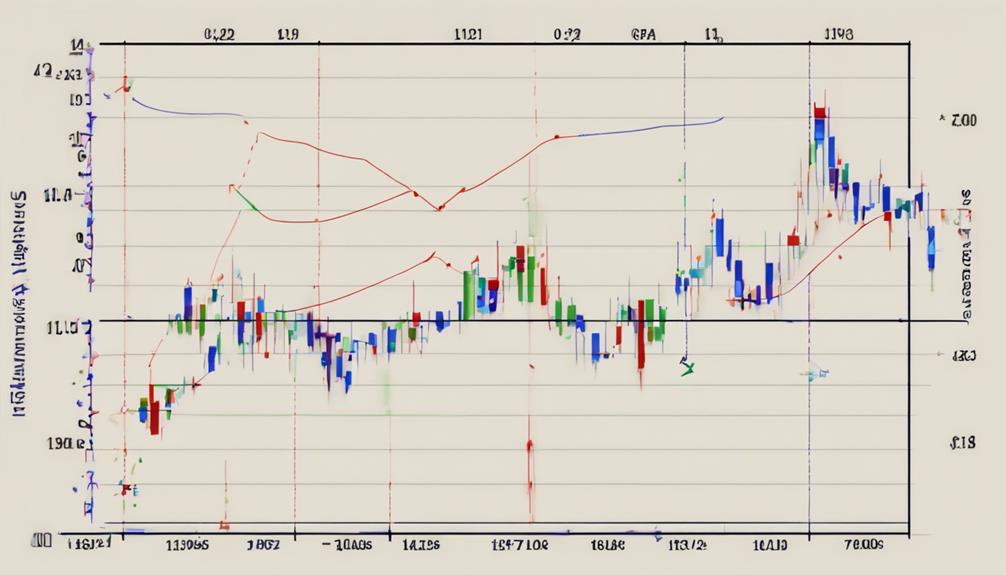
- Standard deviation is a crucial component in creating trading bands such as Bollinger Bands, which are utilized to identify overbought and oversold conditions in the market.
- By applying standard deviation in technical analysis, traders can evaluate historical price variability and market sentiment, allowing for the development of effective trading strategies based on data-driven insights.
Advanced Strategies Using Standard Deviation
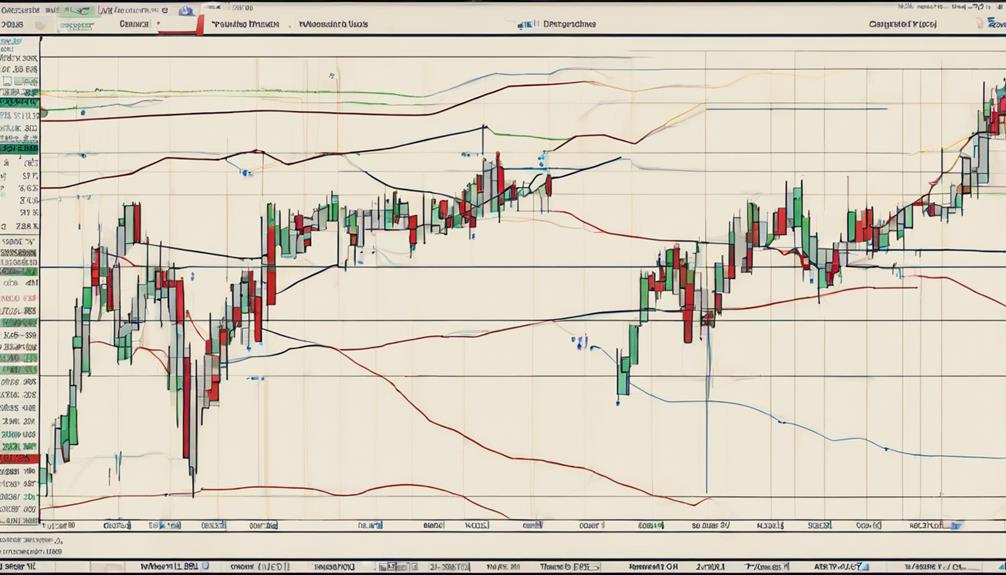
Employing advanced statistical techniques, such as integrating standard deviation with other technical indicators, enhances traders' ability to make informed decisions in volatile market conditions. By combining standard deviation with a moving average, traders can gain insights into market volatility and trend confirmation. This integration allows for the creation of trading bands based on standard deviation levels, providing statistical significance to potential entry and exit points.
Moreover, adjusting position sizes according to standard deviation levels aids in effective risk management, optimizing risk-reward ratios. Traders can also utilize standard deviation to set dynamic stop-loss orders, considering the market's volatility. Assessing market momentum and predicting price movements accurately become more achievable with standard deviation analysis.
How Does Standard Deviation Function as a Technical Indicator in Financial Analysis?
Standard deviation plays a vital role in financial analysis as a technical indicator. It helps investors understand the volatility of a stock or market index. By analyzing the standard deviation of historical data, investors can assess the level of risk associated with an investment and make more informed decisions.
How Does Standard Deviation Help in Technical Analysis of Volatility?
Standard deviation in volatility analysis is a key metric used in technical analysis to measure the dispersion of a set of data points from its mean. It helps traders assess the level of volatility in a stock or market, providing insights into potential price movements and risk management strategies.
Frequently Asked Questions
What Is the Standard Deviation Technical Indicator?
The Standard Deviation technical indicator assesses market volatility by measuring price dispersion from the average. It appears as a blue line on charts, predicting the magnitude of price movements rather than their direction.
What Is the Standard Deviation an Indicator Of?
Standard deviation serves as an indicator of market volatility, reflecting price variability around the mean price. It highlights the stability or instability of the market, with higher values indicating increased volatility and lower values suggesting more stability.
Is Standard Deviation a Leading Indicator?
Standard Deviation, while a valuable tool for assessing market stability and setting risk parameters, is not a leading indicator. It measures historical price volatility around the mean, aiding traders in anticipating potential price movements.
What Is the Standard Deviation Indicator Setting?
The standard deviation indicator setting default is 20, determining the number of periods for deviation calculation. Adjusting above 20 decreases sensitivity, below 20 increases it. Traders often adhere to 20 for consistent volatility analysis.
Conclusion
In conclusion, standard deviation serves as a crucial technical indicator in measuring market volatility and reflecting trader sentiment. Its calculation based on price dispersion from the average price provides valuable insights for making informed trading decisions.
By utilizing standard deviation in technical analysis, traders can better understand market behavior, identify potential trends, and develop advanced strategies to navigate volatile market conditions effectively.
Ultimately, standard deviation is a powerful tool that enhances trading precision and success.