
So, you've dipped your toes into the vast ocean of technical analysis, but the waves of technical indicators seem daunting.
How can you navigate through this sea of information and come out with a clearer understanding of how to use these tools effectively in your trading journey?
Let's start by demystifying the basics and uncovering the hidden gems that can potentially unlock profitable trading opportunities.
Types of Technical Indicators
When delving into the realm of technical analysis, understanding the diverse types of technical indicators is crucial for successful trading strategies. Technical indicators play a vital role in analyzing stock price movements. Overlay indicators, like moving averages, align closely with stock prices, aiding in accurate trend identification.
Independent indicators such as Stochastic and RSI offer unique insights into price movements, while Bollinger Bands and pivot points assist in determining crucial support and resistance levels. Momentum oscillators like MACD and RSI are valuable tools for signaling overbought or oversold conditions in the market.
Additionally, weighted moving averages incorporate volume data, providing a more comprehensive analysis of recent price trends. Mastering these indicators can enhance your ability to make informed trading decisions.
Common Indicator Patterns
Common indicator patterns play a crucial role in aiding traders to identify trends, momentum shifts, overbought or oversold conditions, and potential support/resistance levels in technical analysis.
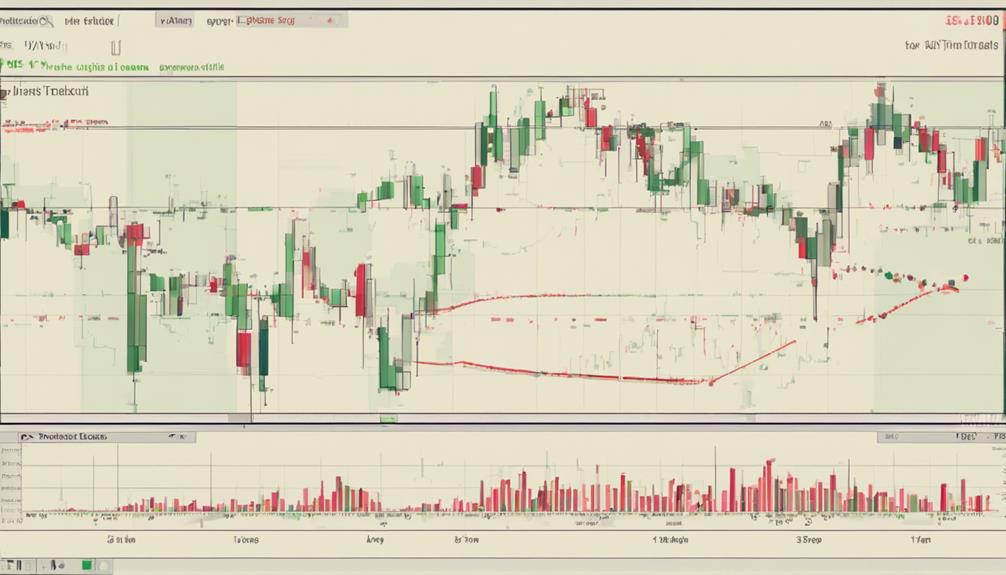
Moving averages show trend direction by indicating the average price over a specific period. MACD measures momentum changes by analyzing the relationship between two moving averages. RSI helps identify overbought or oversold conditions by assessing the speed and change of price movements.
Bollinger Bands are useful for determining potential support and resistance levels based on volatility. Fibonacci retracements assist in predicting potential price levels by identifying key support and resistance levels.
Understanding these common indicator patterns can enhance your ability to interpret market movements and make informed trading decisions.
Applying Indicators in Trading
Are you looking to elevate your trading strategy by effectively applying technical indicators to analyze market conditions and make informed decisions? Here are three key ways to apply indicators in your trading:
- Utilize Moving Averages: Incorporate Simple or Exponential Moving Averages on your charts to identify trends and potential entry/exit points.
- Recognize Patterns: Look for common chart patterns like head and shoulders, triangles, and flags, which can signal potential market reversals or continuations.
- Analyze Market Volatility: Bollinger Bands can help assess market volatility by showing price levels relative to moving averages, aiding in spotting potential breakouts.
Simplifying Indicator Usage

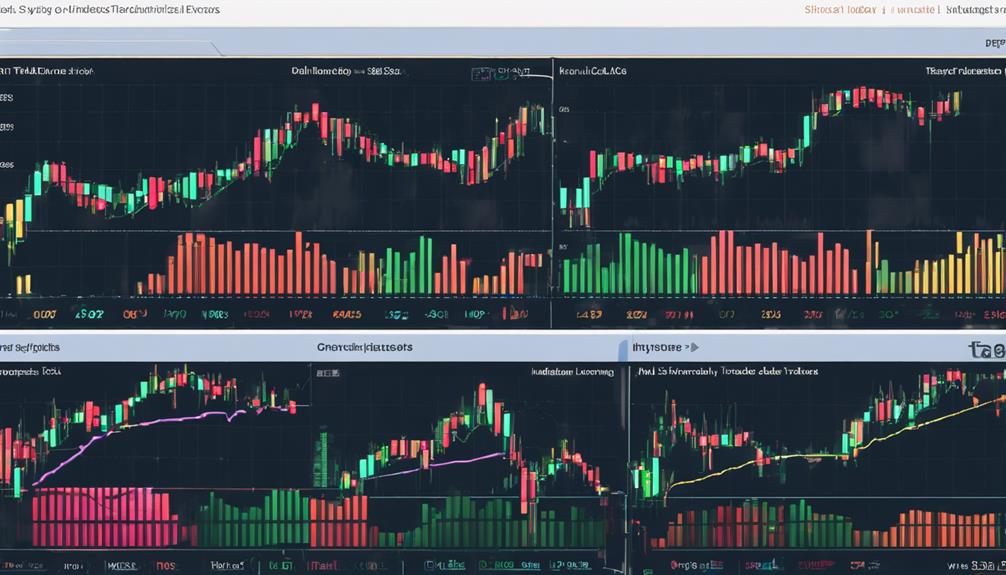
To simplify the usage of technical indicators in your trading strategy, focus on understanding the fundamental principles behind each indicator's function and applicability. Technical indicators, derived from price, volume, and time data, help predict potential price movements accurately. They assist in identifying support and resistance levels, smoothing price action with moving averages, and signaling overbought or oversold conditions.
Common examples like the Stochastic Oscillator and RSI aid in determining market conditions. Start with simple indicators like the simple moving average, analyze relationships between price and momentum indicators, and utilize these signals for making informed trading decisions. By integrating technical indicators into your trading strategies, you can enhance your understanding of trends, patterns, and price dynamics for more effective trading.
Indicator Strategies for Different Styles
When tailoring indicator strategies for different trading styles, it's crucial to consider the specific timeframes and objectives associated with each style.
- Day traders often utilize fast-paced indicators like RSI and MACD for quick entry and exit signals.
- Swing traders rely on moving averages and Bollinger Bands to capture medium-term price movements.
- Long-term investors may use slow indicators like ADX and SMA to identify sustainable trends for strategic decisions.
What Are the Must-Know Technical Indicators for Beginners?
For beginners in the world of trading, understanding technical indicators basics is crucial. The most common ones to start with include moving averages, relative strength index (RSI), and stochastic oscillator. These indicators can help predict market trends and guide trading decisions. It’s essential to familiarize yourself with them.
Frequently Asked Questions
What Is the Best Indicator for Beginners?
For beginners, the best indicator is the moving average. It simplifies trend identification and entry points. Start with basic ones like the 50-day or 200-day moving average. Combining indicators enhances analysis, aiding decision-making in trading.
How to Learn Technical Indicators?
To learn technical indicators, start by grasping basic concepts and gradually delve into specific indicators. Dive into online resources, practice with demo accounts, join trading communities, and analyze real-time charts. Remember, mastery comes with time and experience.
What Is the First Step Guide to Technical Analysis?
To begin mastering technical analysis, understand chart patterns, candlesticks, indicators like moving averages, RSI, MACD, and oscillators. Analyze price action, volume trends, support, and resistance levels. Implement tools on a demo account for practical experience.
What Are the 4 Types of Indicators in Trading?
You have trend-following, momentum, volume, and volatility indicators in trading. Each plays a crucial role—trend identification, entry/exit points, volume confirmation, and risk management. Understanding these indicators enhances your trading strategy and decision-making process.
Conclusion
In conclusion, mastering technical indicators is like adding a new lens to your trading toolkit. By understanding the patterns and signals they provide, you can navigate the complex world of market analysis with more clarity and precision.
Just like a painter using different brush strokes to create a masterpiece, incorporating technical indicators into your trading strategy can help you paint a clearer picture of potential price movements and make more informed decisions.