
Exploring effective strategies for maximizing the potential of the Williams %R indicator can significantly enhance trading outcomes in various market conditions. From pinpointing optimal entry points to managing risk effectively, this indicator offers valuable insights that traders can leverage to their advantage.
By understanding the nuances of interpreting Williams %R signals and integrating them into a comprehensive trading plan, individuals can navigate volatile markets with more precision and confidence.
Stay tuned to uncover the nuances of utilizing this powerful tool to refine trading strategies and optimize performance in dynamic market environments.
Identifying Overbought and Oversold Levels
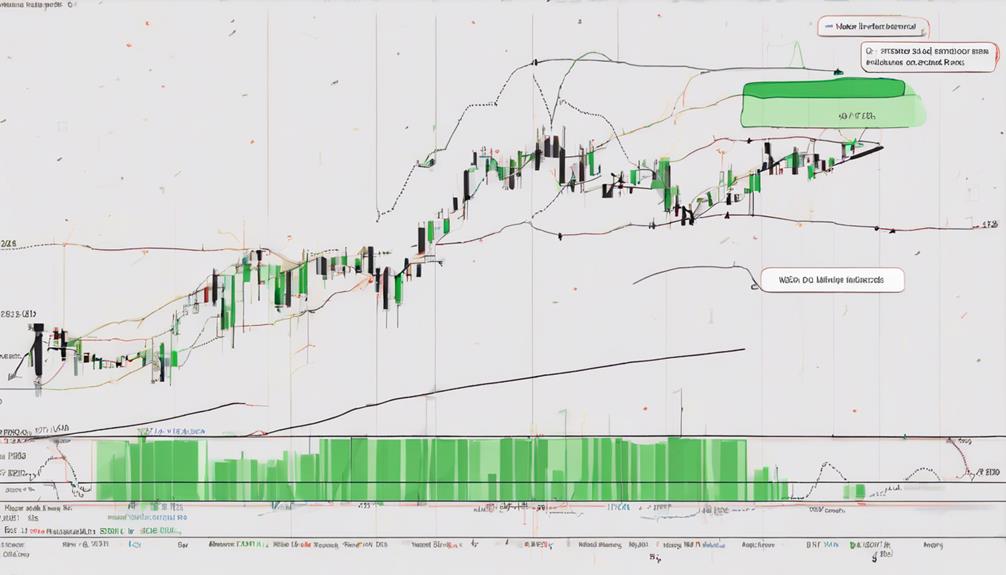
When utilizing the Williams %R indicator, traders can effectively identify overbought and oversold levels in the market to anticipate potential price reversals. The Williams %R, also known as Williams Percent Range, is a popular technical analysis indicator used in trading. It quantifies overbought and oversold levels on a scale from -100 to 0, with readings above -20 signaling overbought conditions and those below -80 indicating oversold conditions.
By recognizing these extreme levels, traders can adjust their strategies accordingly. Overbought conditions suggest that the market may be due for a downward correction, prompting traders to consider selling or taking profits. Conversely, oversold conditions imply a possible price increase, leading traders to explore buying opportunities. Monitoring the Williams %R for these signals provides valuable insights into market dynamics and potential price movements.
Incorporating the Williams %R indicator into a comprehensive trading strategy can enhance decision-making and improve the timing of trades. Combining it with other technical indicators can further refine the identification of overbought and oversold levels, offering traders a more holistic view of market conditions.
Incorporating Divergence Signals for Confirmation
Utilizing divergence signals in the Williams %R indicator enhances the confirmation of potential trend changes and aids traders in adjusting their trading strategies accordingly.
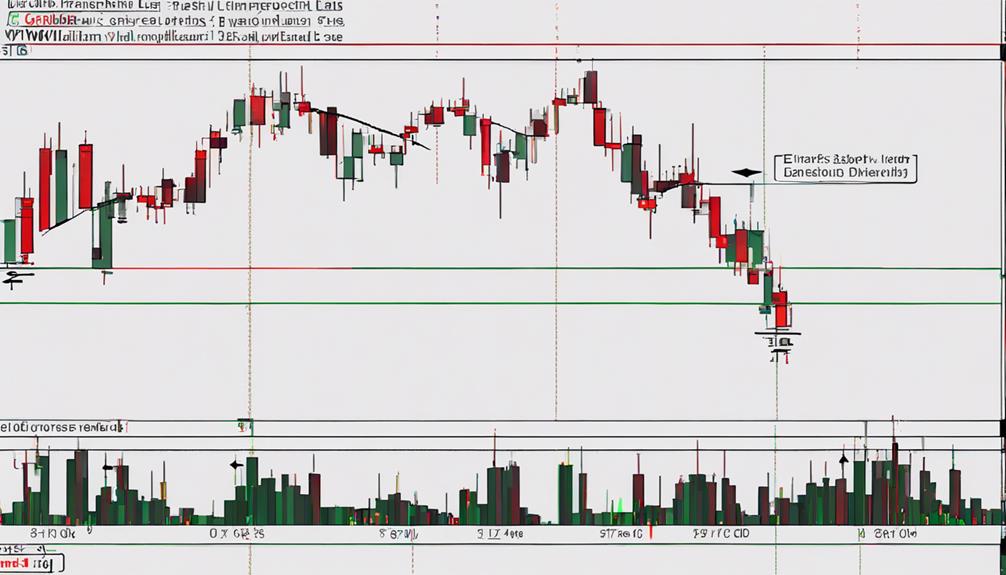
Divergence signals in Williams %R occur when the price and the indicator move in opposite directions, indicating potential weakness or reversal in the trend.
Bullish divergence in Williams %R is characterized by higher lows in the indicator alongside lower lows in prices, suggesting a forthcoming bullish reversal.
On the other hand, bearish divergence in Williams %R shows lower highs in the indicator despite higher highs in prices, indicating a potential bearish reversal.
Traders use these divergence signals to confirm potential trend changes and fine-tune their trading strategies.
By incorporating divergence signals in Williams %R, traders can enhance the accuracy of their trading decisions by receiving early warnings of potential market reversals.
This strategic approach allows for proactive adjustments in trading strategies based on the signals provided by the oscillator.
Utilizing Williams %R for Trend Reversals
By identifying overbought and oversold conditions, Williams %R serves as a valuable tool for detecting potential trend reversals in trading strategies. The indicator helps traders spot key reversal points where a trend may change direction. Bearish divergence, characterized by higher highs in prices and lower highs in Williams %R, suggests a potential trend reversal to the downside.
Conversely, bullish divergence, indicated by lower lows in prices and higher lows in Williams %R, hints at a possible trend reversal to the upside. Traders can use Williams %R in conjunction with other technical analysis tools to confirm trend reversals. Observing price action alongside indicator levels can aid in identifying optimal entry and exit points for trades based on potential reversals.
Implementing Multiple Time Frame Analysis
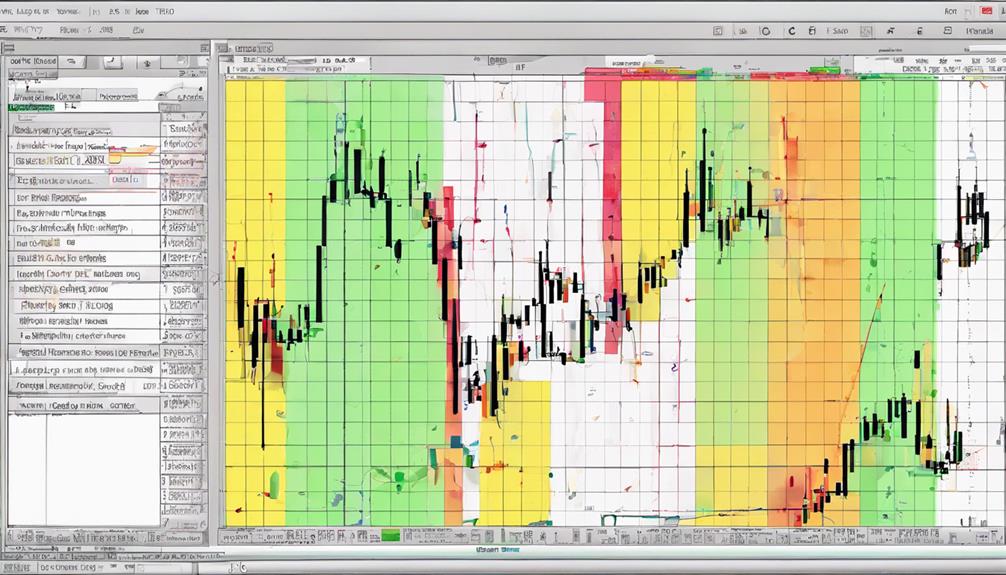
The integration of multiple time frame analysis with the Williams %R indicator offers traders a holistic perspective on market behavior and potential trading opportunities. By utilizing different time frames such as the daily chart, traders can identify overbought and oversold conditions indicated by Williams %R. This information can be further refined by incorporating smaller time frames like hourly or 5-minute charts to pinpoint precise entry and exit points based on the indicator's signals. Through the combination of multiple time frames, traders can anticipate market reversals and capitalize on price movements effectively.
Multiple time frame analysis with Williams %R is a crucial component of trading strategies as it enhances the ability to time trades accurately. This approach provides early signals for potential entry and exit points, enabling traders to make informed decisions and improve the overall effectiveness of their trading strategies. By incorporating multiple time frames into the analysis, traders can gain a comprehensive understanding of market dynamics and optimize their trading approach for better results.
Setting Effective Stop Loss and Take Profit Levels
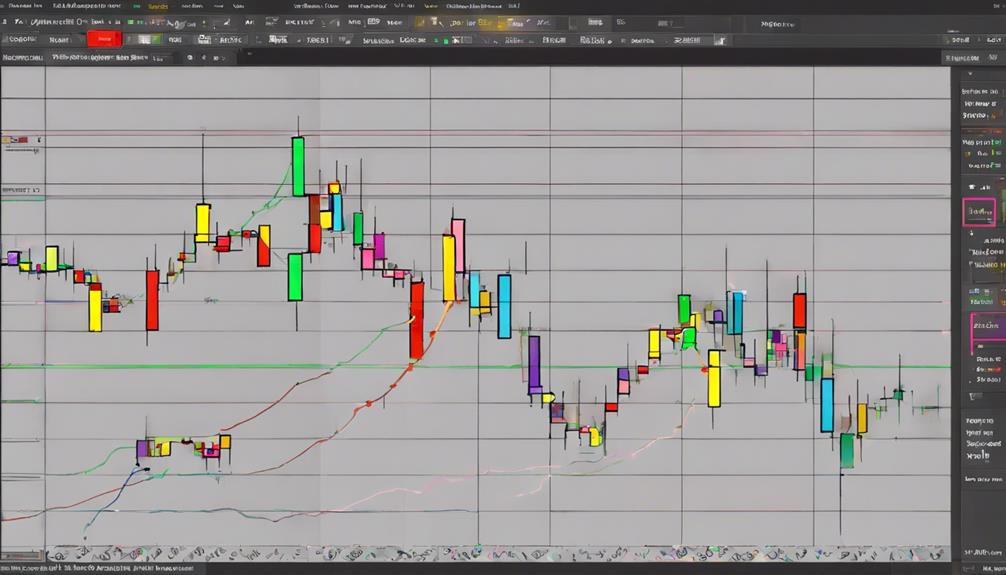
Effective implementation of stop loss and take profit levels is paramount in trading strategies utilizing the Williams %R indicator to manage risk and maximize profits. Setting stop loss levels based on recent price action and support/resistance levels enhances protection against losses. Utilizing indicators like ATR or other volatility-based measures aids in determining appropriate stop loss placements that consider market fluctuations.
Take profit levels can be strategically positioned at key resistance levels or based on the trade's risk-reward ratio to secure profits at advantageous points. Traders may opt for trailing stop losses to lock in profits progressively as the trade progresses favorably, adjusting the stop loss level according to evolving market conditions.
Adherence to a disciplined approach in setting stop loss and take profit levels is crucial for effective risk management and optimal trading outcomes when employing the Williams %R indicator. By incorporating these strategies, traders can strive for a balanced approach that mitigates risks while maximizing profit potential.
What Are the Most Effective Strategies for Utilizing the Williams %R Indicator?
When utilizing Williams %R indicator, it’s important to combine it with other technical analysis tools for better accuracy. Use it to identify overbought or oversold conditions and wait for confirmation from other indicators before making trading decisions. Additionally, consider using it in conjunction with trend analysis for more effective strategies.
Frequently Asked Questions
What Is the Best Setting for Williams R?
The optimal setting for the Williams %R indicator varies based on traders' preferences and objectives. Adjusting periods can enhance sensitivity or reliability. Shorter settings provide more signals with potential unreliability, while longer settings reduce false signals but may lag in detecting market extremes.
What Is the Williams Trading Strategy?
The Williams Trading Strategy leverages the Williams %R indicator to pinpoint overbought and oversold market conditions. By identifying entry and exit points during price pullbacks, traders can capitalize on trends and potential reversals effectively.
What Is the Best Moving Average Indicator Strategy?
The best moving average indicator strategy involves combining Williams %R with a 100-period moving average for buy and sell signals. This strategy is effective for volatile stocks, providing clear entry and exit points based on indicator crossovers.
Is the Williams Indicator Good?
Is the Williams indicator good? Williams %R is a valuable momentum indicator, helping traders identify overbought and oversold market conditions, potential trend reversals, and price movement strength. When used wisely, it can enhance trading decisions significantly.
Conclusion
In conclusion, the utilization of the Williams %R indicator in trading strategies can lead to astronomical gains or devastating losses.
By carefully analyzing overbought and oversold levels, incorporating divergence signals, identifying trend reversals, and implementing multiple time frame analysis, traders can navigate the market with precision.
Setting effective stop loss and take profit levels is crucial in maximizing profits and minimizing risks.
Mastery of these strategies can propel traders to unparalleled success in the financial markets.