
When navigating the intricate world of trading, it's essential to be equipped with a repertoire of technical indicators that can guide your decisions. From identifying trends to pinpointing potential reversals, these indicators serve as invaluable tools in your trading arsenal.
But which ones should you prioritize? Let's explore the fundamental technical indicators that traders rely on to navigate the dynamic landscape of the financial markets and stay ahead of the curve.
Key Technical Indicators Overview
What're the key technical indicators that traders rely on for analyzing market trends and identifying trade opportunities effectively?
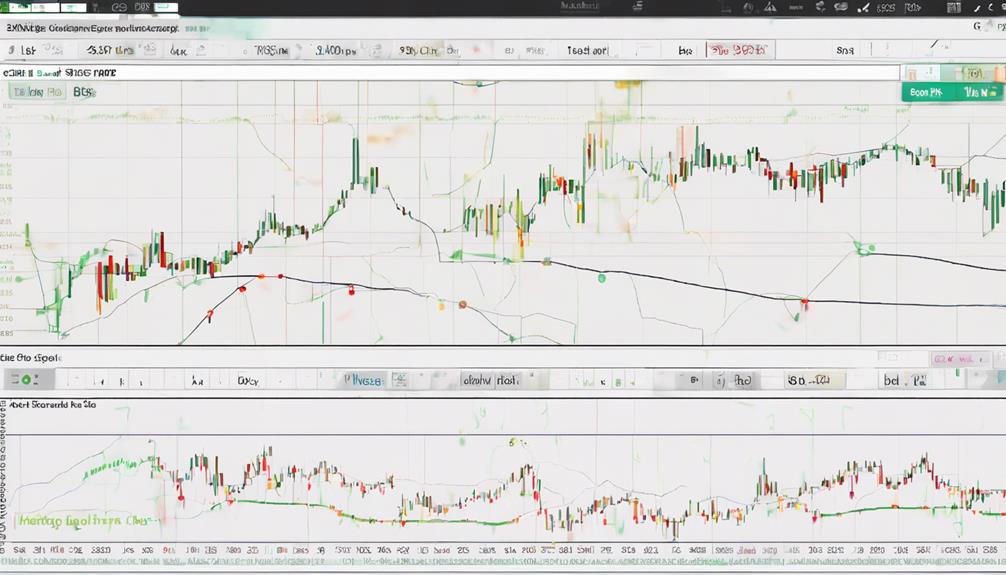
Traders often utilize a combination of moving averages, Bollinger Bands, stochastic oscillator, MACD, RSI, volume indicators like On-Balance Volume and Accumulation/Distribution Line, as well as trend and momentum indicators.
Moving averages help smooth out price data to identify trends, while Bollinger Bands assist in determining overbought or oversold conditions. The stochastic oscillator and RSI gauge momentum and indicate potential market reversal points.
MACD is valuable for analyzing trend strength and potential crossovers. Volume indicators like On-Balance Volume and Accumulation/Distribution Line are crucial for confirming trends and signaling possible reversals.
Trend-Following Indicators Deep Dive
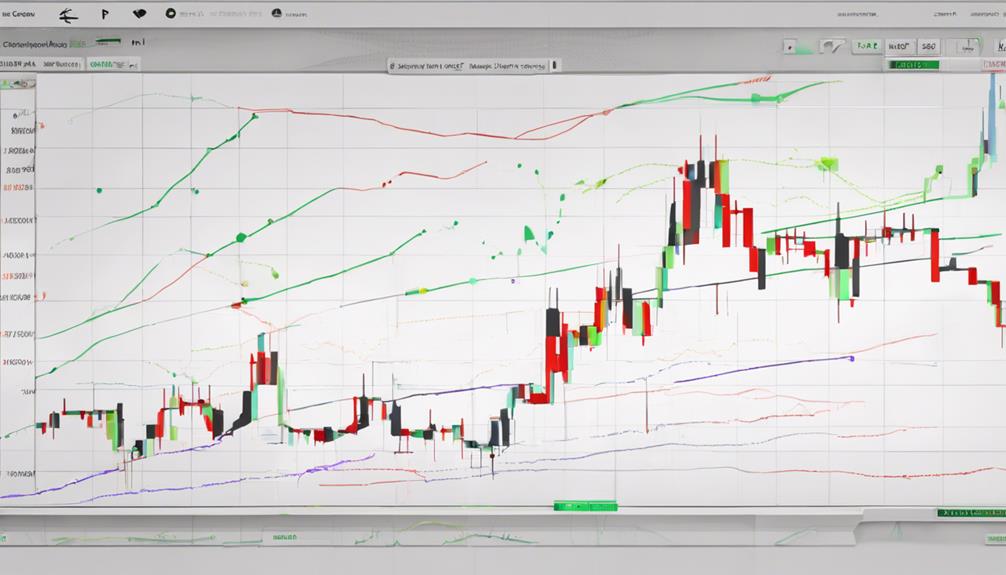
Delving into an intricate exploration of trend-following indicators reveals their pivotal role in guiding traders towards aligning with market trends effectively. Moving averages, including the Moving Average Convergence Divergence (MACD) and the Average Directional Index (ADX), assist in identifying trend direction, momentum, and the strength of a trend.
These indicators are crucial for confirming trend presence and aiding in the decision-making process for entering or exiting trades. By utilizing trend-following indicators adeptly, traders can position themselves in accordance with the prevailing market direction, enhancing the probability of successful trades.
Understanding how these indicators interpret price data empowers traders to navigate the dynamic nature of the market with greater insight and confidence.
Momentum Indicators Explained
Momentum indicators, such as the Relative Strength Index (RSI) and Stochastic Oscillator, play a crucial role in helping traders assess the strength of price movements and make informed decisions based on market momentum.
- RSI measures speed and price change, identifying overbought or oversold conditions.
- Stochastic Oscillator compares closing price to the price range for trend reversals.
Analyzing momentum assists in making informed decisions.
Understanding market trends and entry/exit points is facilitated by these indicators.
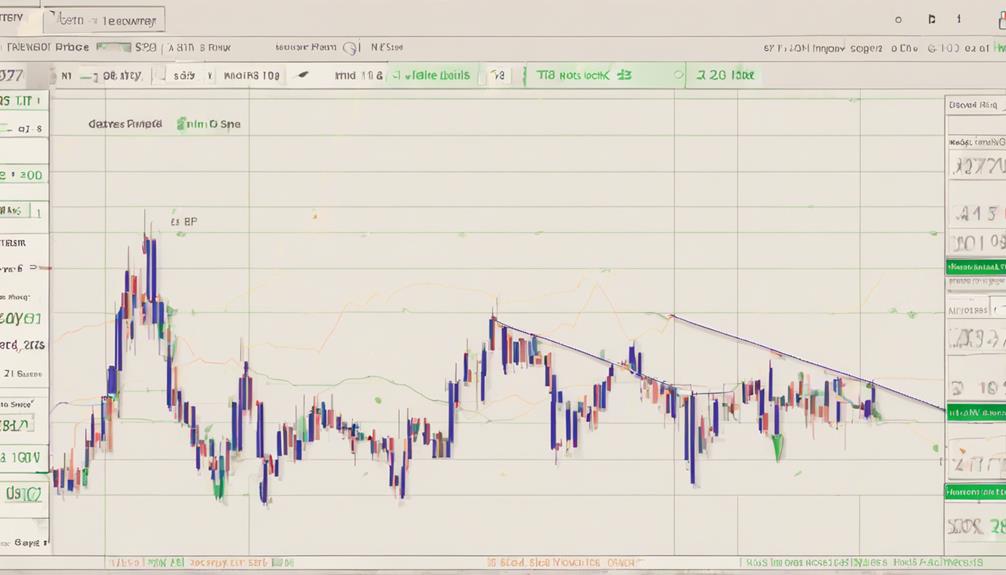
Understanding Trend-Reversal Indicators
Trend-reversal indicators, such as Bollinger Bands, are instrumental tools that traders use to gauge price volatility and anticipate potential reversal points in the market based on deviations from a moving average.
Bollinger Bands expand and contract with market volatility, indicating potential trend reversals. Traders rely on these bands to identify overbought or oversold conditions, predicting price movements towards the mean. The upper and lower bands of Bollinger Bands serve as dynamic support and resistance levels, aiding traders in assessing market sentiment.
Leveraging Multiple Indicators for Analysis
To enhance your trading analysis and decision-making process, incorporating a combination of various technical indicators, such as moving averages, RSI, MACD, and Stochastic Oscillator, is crucial for gaining comprehensive insights into market dynamics and trends.
- Confirm Signals: Utilize multiple indicators to validate trading signals.
- Identify Trends: Combine indicators to spot and confirm market trends.
- Assess Momentum: Analyze momentum using different indicators for a holistic view.
- Determine Overbought or Oversold Conditions: Identify potential reversal points by assessing overbought or oversold levels.
Are Essential Technical Indicators the Same as Basic Trading Technical Indicators?
Essential technical indicators are not the same as basic trading technical indicators explained. While basic trading indicators provide entry and exit signals, essential technical indicators offer a deeper analysis of market trends and price movements. Traders often use a combination of both to make well-informed trading decisions.
Frequently Asked Questions
What Technical Indicators Every Trader Should Know?
To navigate the markets successfully, you must grasp key technical indicators. Understanding RSI, Stochastic Oscillator, moving averages, Bollinger Bands, and MACD is crucial. These tools reveal market trends, momentum, volatility, and potential trade entry/exit points.
What Is the Best Indicator to Use When Trading?
When trading, the best indicator for you depends on your strategy and goals. Experiment with indicators like RSI, Stochastic Oscillator, and MACD to find what suits you. Each offers unique insights into market conditions.
What Are the Top 5 Stock Indicators?
When trading stocks, focus on five key indicators: MACD for trend changes, RSI for price movements, Bollinger Bands for volatility analysis, Stochastic Oscillator for momentum, and OBV for volume insights. Mastering these can enhance your trading strategy.
What Are the 4 Types of Indicators in Trading?
When trading, understand the 4 types of indicators: trend-following, momentum, volatility, and volume. Recognize trends, measure price changes, assess market fluctuations, and track trade volume. These indicators guide decisions, revealing market dynamics crucial for traders' success.
Conclusion
As you navigate the intricate world of trading, remember that technical indicators are your trusty companions in deciphering market movements. Like a skilled sailor relying on the stars to guide their ship, traders use moving averages, Bollinger Bands, and oscillators to navigate the turbulent waters of the financial markets.
By combining these tools with chart patterns, you can chart a course towards informed decision-making and profitable trading opportunities.
Smooth sailing ahead, captain!