
Did you know that Fibonacci retracement ratios, such as 23.6% and 61.8%, play a crucial role in technical analysis for traders?
These ratios hold significance in identifying potential price reversal levels within financial markets.
By understanding how these levels are calculated and applied, you can enhance your trading strategies and improve decision-making processes.
Want to uncover the secrets behind these powerful Fibonacci ratios and how they influence market dynamics?
Origins of Fibonacci Ratios
The origins of Fibonacci ratios can be traced back to the Fibonacci sequence introduced by Leonardo Pisano in the Middle Ages. Before Leonardo Fibonacci, an Indian mathematician named Acarya Virahanka had already formulated the Fibonacci numbers around 600 A.D. These numbers were known in Indian society as early as 200 B.C.
The Fibonacci sequence, where each number is the sum of the two preceding ones, forms the basis for the Fibonacci ratios used in technical analysis today. Ratios like 61.8% and 161.8% are derived from dividing numbers within the Fibonacci sequence. Leonardo Fibonacci further popularized these numbers in his book Liber Abaci, which had a significant impact on modern technical analysis methods.
Calculating Fibonacci Retracement Levels
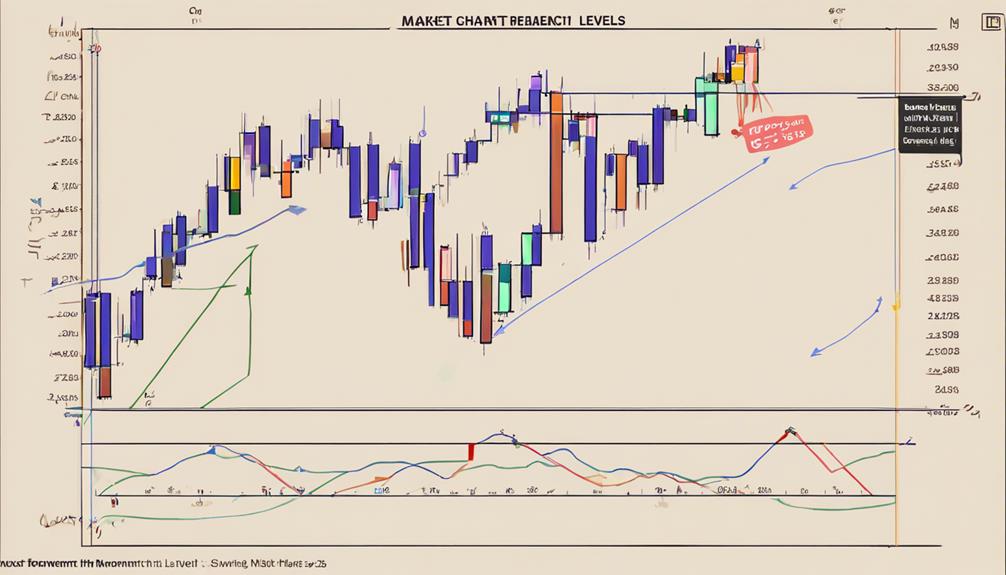
To calculate Fibonacci retracement levels, you'll need to draw lines at specific percentages between two significant price points. These levels are based on key Fibonacci ratios such as 23.6%, 38.2%, 50%, 61.8%, and 78.6%, derived from the Fibonacci sequence and the Golden Ratio.
Traders utilize these Fibonacci retracement levels in technical analysis to identify potential support and resistance levels in the market. By applying the Fibonacci retracement tool to price points, traders can make more informed decisions regarding placing orders, setting price targets, and determining stop-loss levels.
Understanding these Fibonacci retracement levels is essential for interpreting market commentary and making strategic trading decisions based on historical price levels and potential future price movements.
Interpreting Fibonacci Ratios
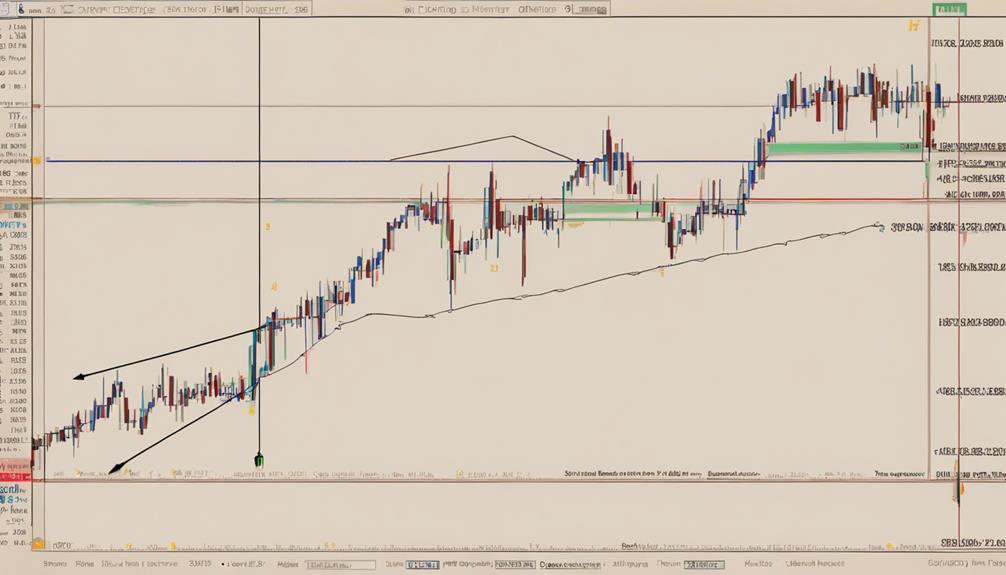
Interpreting Fibonacci Ratios involves analyzing key levels derived from the Fibonacci sequence to predict potential market movements and make informed trading decisions.
When interpreting Fibonacci retracement ratios, consider the 23.6%, 38.2%, 50%, 61.8%, and 78.6% ratios to identify potential support and resistance levels. The 61.8% ratio, known as the golden ratio, holds significance in technical analysis.
Traders utilize these ratios to anticipate price reversals and determine optimal entry or exit points in the market. By understanding how Fibonacci retracement ratios are linked to historical price movements, traders can effectively set stop-loss orders, establish target prices, and execute trades with more precision.
Application of Fibonacci Retracement
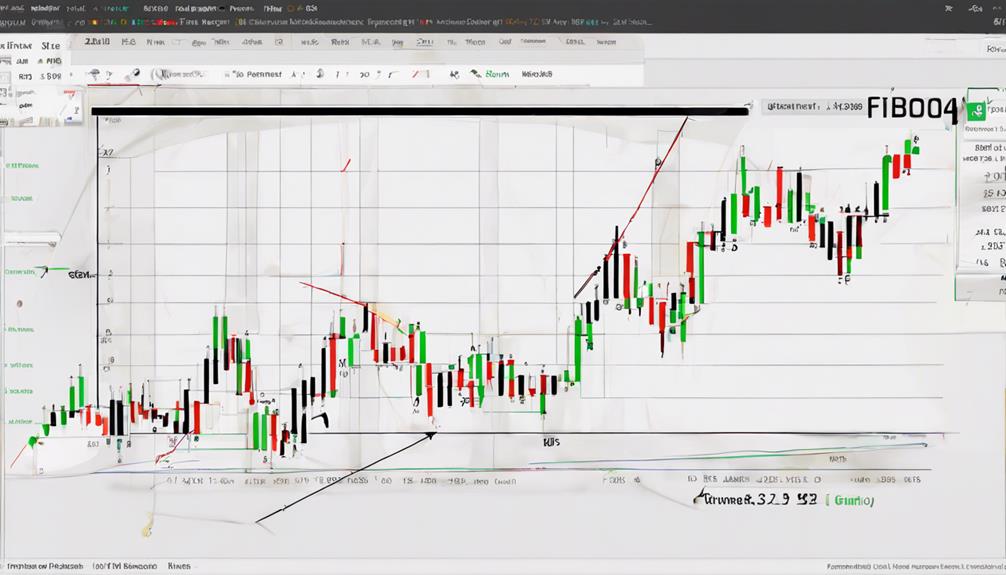
Utilize Fibonacci retracement ratios as key levels to pinpoint potential support and resistance areas in your trading strategies. Traders use these Fibonacci ratios to analyze historical price movements and identify significant levels in the market.
By plotting Fibonacci retracement levels, traders can establish support and resistance lines that help determine entry and exit points. The 61.8% retracement level, known as the golden ratio, holds particular importance as it often indicates a strong potential reversal point in price trends.
These levels derived from the Fibonacci sequence play a crucial role in technical analysis, enabling traders to make more informed decisions based on the analysis of past price action. Incorporating Fibonacci retracement levels in your trading strategy can enhance your ability to interpret and react to market movements effectively.
Advantages and Limitations
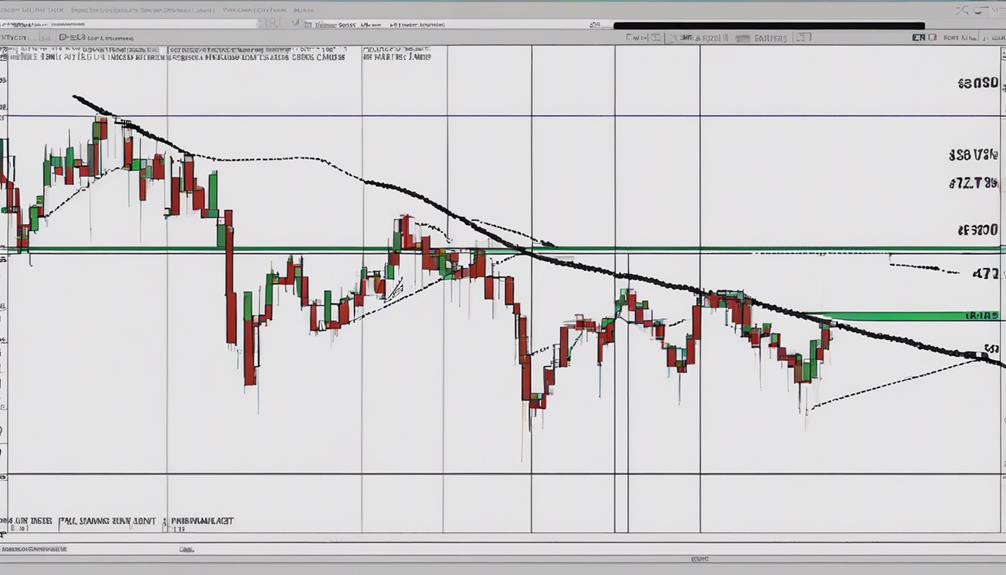
Fibonacci retracement ratios play a crucial role in technical analysis by helping traders identify potential support and resistance levels in the market. When considering these ratios, it's essential to understand both their advantages and limitations:
- Advantages:
- Assist in identifying key support and resistance levels.
- Aid in setting entry and exit points for trades.
- Derived from the Fibonacci sequence, providing a mathematical basis for analysis.
- Useful in predicting potential price reversals.
- Can be used in conjunction with other technical indicators for confirmation.
Despite their benefits, it's important to recognize the limitations of Fibonacci retracement ratios. They should be used as part of a broader technical analysis strategy to enhance decision-making in trading scenarios.
Can Fibonacci Retracement Ratios and Levels be Used Interchangeably?
When using Fibonacci retracement levels, it’s essential to understand how they differ from Fibonacci retracement ratios. While both are based on the Fibonacci sequence, the levels are more specific. To master the application of these tools, refer to a comprehensive guide on Fibonacci retracement levels.
Frequently Asked Questions
Why Is 61.8 a Golden Ratio?
In Fibonacci analysis, 61.8% is a golden ratio due to its prevalence in nature and design. This ratio, derived from the Fibonacci sequence, signifies key retracement levels, aiding in identifying support and resistance areas in trading.
What Is the Most Effective Fibonacci Retracement Level?
In trading, the most effective Fibonacci retracement level is often considered to be 61.8%. This level, known as the golden ratio, is crucial for spotting price reversals. Traders frequently use it for trend continuation.
How Are Fibonacci Ratios Calculated?
When calculating Fibonacci ratios, start by dividing two consecutive numbers in the sequence to derive percentage values like 23.6%, 38.2%, 50%, 61.8%, and 78.6%. These ratios help traders predict potential price levels, aiding in strategic decision-making.
Why Is 1.618 so Important?
1.618 is vital due to its presence in nature, art, and trading. It's a key ratio for Fibonacci extensions, aiding in profit target determination. In technical analysis, it's pivotal for identifying potential price reversals.
Conclusion
You've learned the basics of Fibonacci retracement ratios and how they can be applied in trading.
Did you know that studies have shown that price movements often exhibit reversals at Fibonacci levels?
In fact, around 50% of traders use Fibonacci retracement levels in their technical analysis to make informed trading decisions.
By understanding these ratios and how to interpret them, you can improve your trading strategy and potentially increase your chances of success in the market.