
Analyzing stock volatility with standard deviation is a cornerstone of risk assessment in the world of investments. By employing this statistical measure, investors can gain valuable insights into a stock's price fluctuations and potential risks.
However, to truly master the art of stock volatility analysis, one must go beyond basic calculations and explore the five best methods that leverage standard deviation for informed decision-making. These strategies not only provide a deeper understanding of market dynamics but also offer a competitive edge in navigating the complexities of investment landscapes.
Understanding Stock Volatility Analysis
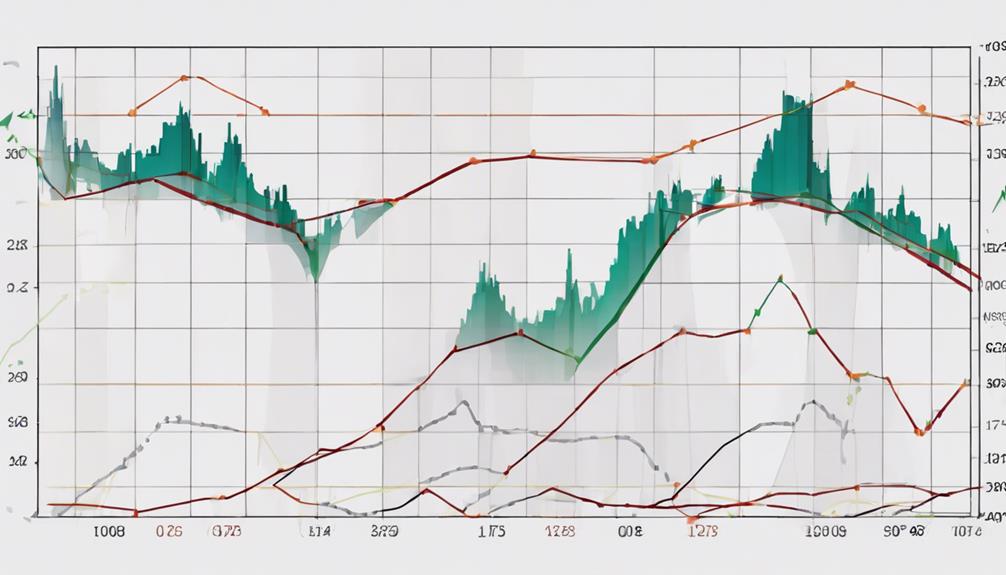
Stock volatility analysis, a crucial aspect of financial evaluation, relies on the utilization of standard deviation to measure the dispersion of stock returns around the mean. This analysis provides valuable insights into the consistency and variability of a stock's price movements, aiding investors in assessing risk and making informed decisions. When applied to a portfolio, standard deviation allows for the comparison of volatility among different stocks, enabling investors to diversify effectively and manage risk exposure.
Historical volatility, calculated using past price movements, helps investors gauge how much a stock's price has fluctuated over a specific period. On the other hand, implied volatility, derived from option prices, reflects the market's expectations for future price movements. Understanding these different types of volatility and how they interact with standard deviation is essential for constructing a well-balanced investment portfolio.
Calculating Volatility With Standard Deviation
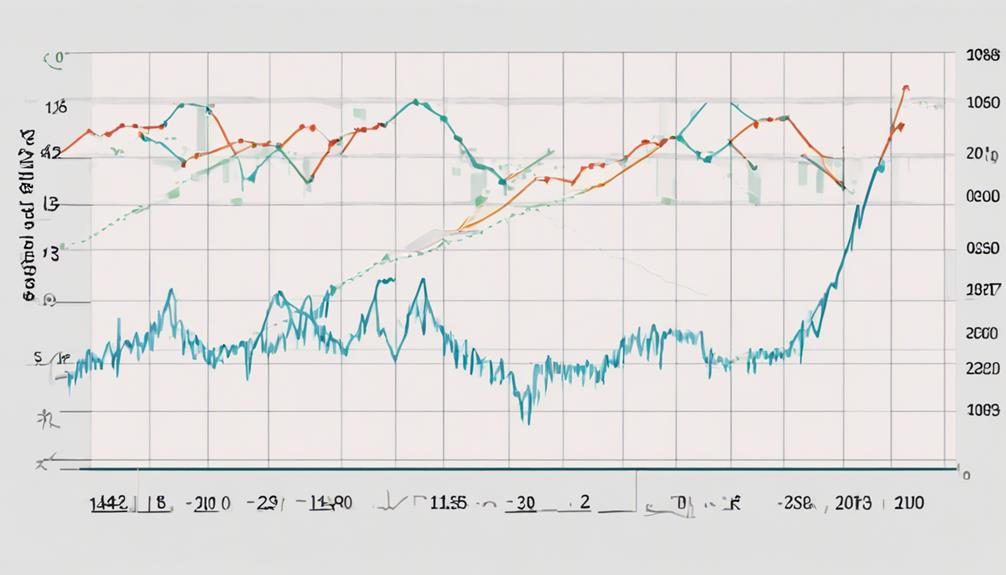
Utilizing statistical analysis, the calculation of volatility through standard deviation is a fundamental method in assessing the dispersion of data points from the mean, providing insight into the variability of asset prices. Standard deviation plays a crucial role in quantifying the risk associated with stock prices by measuring how far prices deviate from the average.
To calculate volatility using standard deviation, one must first determine the mean return of the stock. Subsequently, deviations of individual data points from this mean are computed, squared, summed, and then the square root is taken. This process results in a numerical representation of the extent of price fluctuations, aiding investors in comparing the volatility of various stocks or portfolios.
Ultimately, standard deviation serves as a key tool in analyzing stock volatility, offering a quantitative measure that assists in making well-informed investment decisions based on the level of risk associated with price movements.
Interpreting Standard Deviation Results
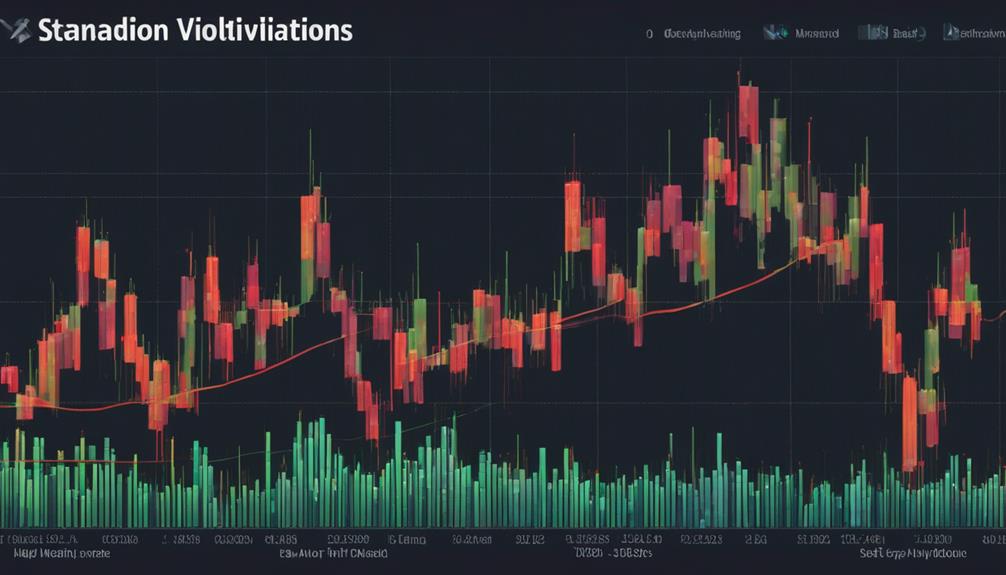
Interpreting the results of standard deviation provides crucial insights into the volatility of asset prices, aiding in the comparison of risk levels among different stocks or portfolios.
Standard deviation, as a measure of volatility, quantifies the extent to which data points deviate from the mean in a data set. A low standard deviation indicates that the data points are closely clustered around the mean, suggesting lower volatility. Conversely, a high standard deviation signifies that the data points are more spread out from the mean, indicating higher volatility.
To calculate standard deviation, deviations are squared, summed, and then the square root is taken to determine the volatility measure.
Interpreting standard deviation results is essential for investors as it allows for a comparative analysis of the volatility of various stocks or portfolios, enabling informed decision-making based on the risk levels associated with different investments.
Utilizing Volatility Bands for Analysis
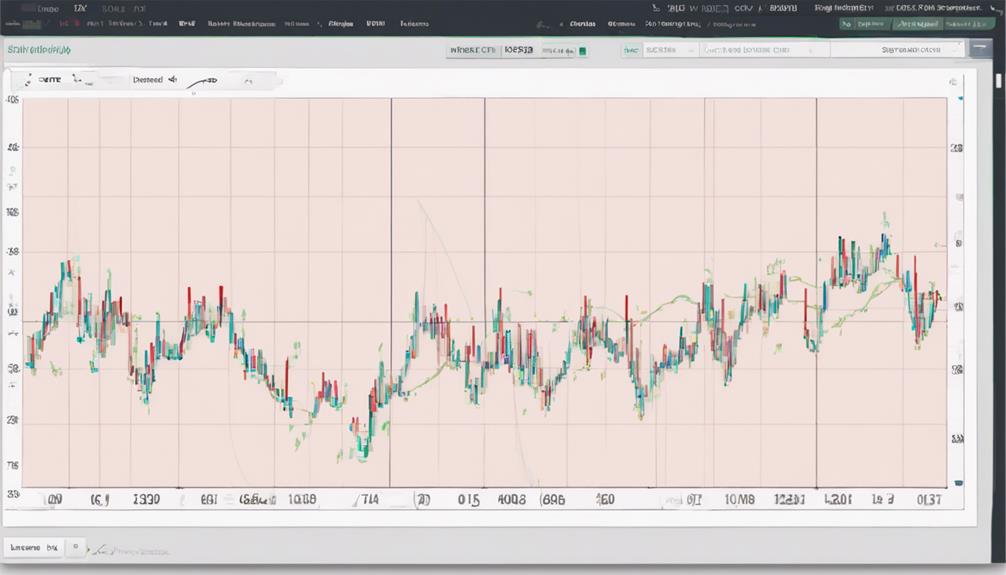
Volatility bands serve as visual tools for analyzing stock price movements within a specified range based on standard deviation. When utilizing volatility bands for technical analysis, traders can benefit from the following key points:
- Identification of Overbought or Oversold Conditions: Volatility bands assist in recognizing when a stock may be overbought or oversold, signaling potential reversal points.
- Resistance and Support Levels: The upper band of the volatility bands represents potential resistance levels, where price movements might stall, while the lower band indicates possible support levels, where price declines could halt.
- Assessment of Price Movements: By comparing price movements to volatility bands, traders can evaluate the stock's volatility and make more informed trading decisions based on potential trend reversals or continuations.
Incorporating volatility bands into technical analysis allows traders to gauge the volatility of a stock, identify critical price levels, and anticipate potential market movements with greater clarity and precision.
Implementing Standard Deviation in Trading
Implementing Standard Deviation in trading provides traders with a quantitative measure to assess the variability of stock returns around the mean. By using standard deviation, traders can gauge the historical volatility of a stock, helping them identify potential price fluctuations and evaluate risk levels.
Calculating standard deviation offers insights into the stock's stability and predictability, enabling traders to make more informed decisions. Incorporating standard deviation into trading strategies is crucial as it assists in managing risk effectively. Traders can adjust their positions based on the level of volatility indicated by standard deviation, allowing for a proactive approach to market changes.
Understanding the standard deviation of stock returns is key to developing robust trading strategies that can adapt to varying market conditions. By utilizing standard deviation in trading, investors can enhance their risk management techniques and optimize their overall trading performance.
How Can Standard Deviation Help Analyze Stock Volatility in Market Trend Prediction?
One of the key uses of standard deviation is in analyzing stock volatility for market trend prediction. By measuring the amount of variation or dispersion of a set of stock returns, standard deviation provides insight into the level of risk and potential future movements in the market.
Frequently Asked Questions
How Do You Use Standard Deviation to Determine Volatility?
Standard deviation is utilized to gauge volatility by measuring how much a stock's price deviates from its average. High values indicate greater price fluctuation and risk, while low values signify stability. This aids investors in risk assessment and decision-making.
What Is the Standard Approach to Estimating Volatility?
The prevailing methodology for gauging volatility involves utilizing standard deviation to analyze historical price movements, determining the dispersion of returns around the mean in stock price data. This quantitative measure aids in evaluating risk levels and assessing stock price variability.
Why Is Beta Better Than Standard Deviation?
Beta is favored over standard deviation for assessing stock volatility due to its consideration of market correlation. Beta provides a relative comparison to market risk, offering a more comprehensive measure of a stock's volatility and risk profile.
How Do You Use Standard Deviation in Stock Trading?
In stock trading, standard deviation acts as a compass guiding investors through the sea of market volatility. It measures the dispersion of returns around the mean, offering insights into price consistency and risk levels.
Conclusion
In conclusion, analyzing stock volatility with standard deviation is essential for risk assessment and informed decision-making in investments.
By calculating standard deviation, investors can measure price fluctuations and gauge the level of risk associated with a particular stock.
For example, if Stock A has a higher standard deviation compared to Stock B, it indicates that Stock A is more volatile and carries a higher risk.
This information can help investors make strategic investment choices based on their risk tolerance and objectives.