
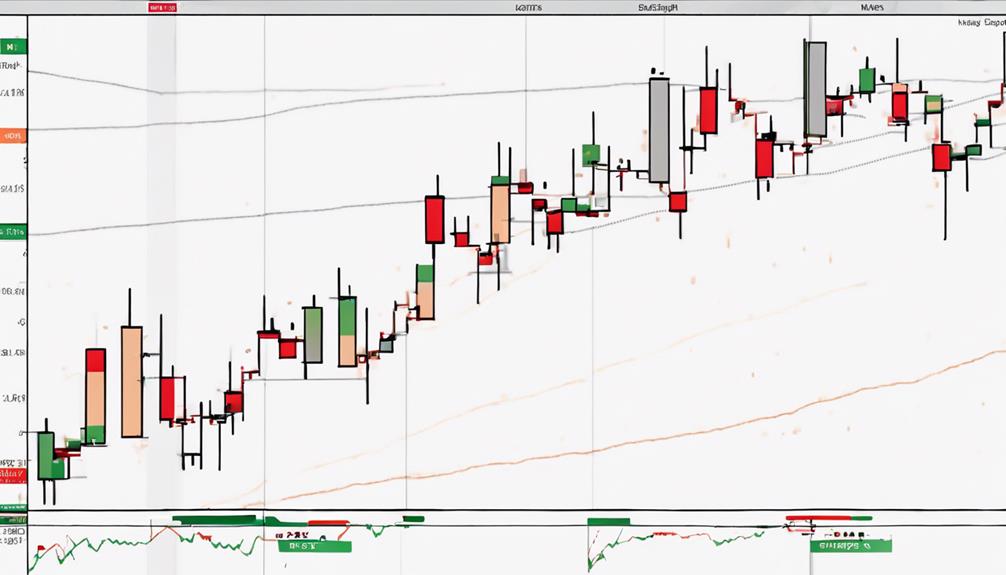
As you navigate the intricate landscape of technical analysis, advanced candlestick patterns serve as strategic signposts, much like expertly placed road markers on a winding path.
Delving into the intricacies of the Island Reversal Pattern, Hook Reversal Pattern, San-Ku (Three Gaps) Pattern, Kicker Pattern, and Evening and Morning Stars, Hikkake Pattern can offer you a deeper understanding of market dynamics and potential shifts in price movements.
Understanding why these patterns have stood the test of time and how they can influence your trading decisions may just be the missing piece you've been looking for to elevate your trading game.
Island Reversal Pattern
The Island Reversal Pattern, characterized by a distinctive gap signaling a potential trend reversal, is a key indicator used by traders for short-term analysis. This reversal signal highlights a period of indecision in the market, showcasing a battle between bulls and bears.
Traders keenly observe the isolation of price movement and the presence of a gap, followed by another gap in the opposite direction to confirm the pattern. The significance of this pattern is amplified when it emerges after a substantial trend, indicating a possible shift in market direction.
Entry and exit points are often determined by monitoring the break of the high or low points of the isolated price movement, aiding traders in making informed decisions within this short-term trend context.
Hook Reversal Pattern

With a sharp reversal in price direction, the Hook Reversal Pattern signifies potential trend changes, offering traders opportunities for strategic entry and exit points.
Traders use this short-term reversal pattern to capitalize on potential trend changes.
Profit-taking opportunities arise as the pattern displays a sharp reversal in price direction.
Bulls and bears engage in a battle, reflecting market indecision.
This pattern highlights sudden shifts in market sentiment.
San-Ku (Three Gaps) Pattern
Anticipating market trend reversals, the San-Ku (Three Gaps) Pattern presents traders with a distinctive signal based on the occurrence of three price gaps. This pattern is a reliable candlestick pattern indicating potential bullish or bearish reversals.
The Three Gaps in the San-Ku Pattern usually appear in the opposite direction of the current trend, signaling a shift in market sentiment. Traders analyze this pattern along with other indicators to confirm the reversal and plan their entry or exit strategies accordingly.
Successfully identifying and interpreting the Three Gaps in the San-Ku Pattern can provide valuable insights into potential trend changes. When combined with other technical analysis tools, such as the Morning Star pattern, traders can make more informed decisions in the dynamic world of trading.
Kicker Pattern
Characterized by its strong and reliable signals for potential price reversals, the Kicker Pattern stands out as a key candlestick pattern in technical analysis.
- Traders typically enter near the close of the kicker candle with high volume to confirm the pattern.
- This pattern is associated with significant price moves and often leads to gaps, causing sharp shifts in market direction.
- The Kicker Pattern is characterized by a sudden and decisive change in market sentiment, making it valuable for identifying trend reversals.
- Utilizing the Kicker Pattern in technical analysis can provide insights into market dynamics and help traders make informed trading decisions.
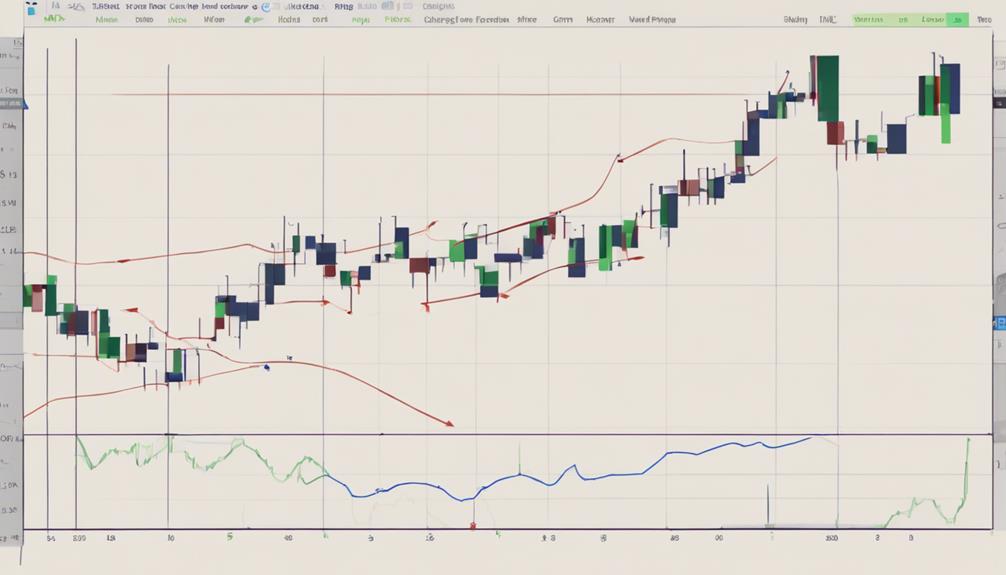
Why These Patterns Work
In understanding the rationale behind the effectiveness of these advanced candlestick patterns, consider how market dynamics are influenced by the interplay of bullish and bearish forces, ultimately driving significant price movements and signaling potential shifts in trend direction.
The Evening Star patterns, Island Reversal, Hook Reversal Pattern, San-Ku Pattern, and Kicker Pattern all play crucial roles in identifying potential trend reversals or continuations.
The bullish trend is characterized by patterns like the Kicker Pattern, indicating strong upward momentum. Conversely, bearish patterns like the Island Reversal suggest indecision and possible trend reversals.
Do Advanced Candlestick Patterns Include Essential Bearish Patterns for Technical Analysis?
Yes, advanced candlestick patterns do include essential bearish candlestick patterns for technical analysis. Recognizing these essential bearish patterns can help traders identify potential downtrends and make informed decisions about when to sell or short a stock. Understanding these patterns is key for successful technical analysis.
Frequently Asked Questions
What Is the Most Powerful Candlestick Pattern?
The most powerful candlestick pattern is the Kicker Pattern. It signals significant price moves and sharp shifts in direction, making it a valuable signal for traders. Entering near the close with high volume can help capture potential trend reversals.
What Is the Most Accurate Candlestick Pattern?
The most accurate candlestick pattern is often deemed the Three White Soldiers. It signals a robust uptrend continuation with three consecutive long white candles showing higher highs and higher lows, reflecting bullish momentum and potential trading opportunities.
How Many Candlestick Patterns Are There in Technical Analysis?
In technical analysis, there are over 50 recognized candlestick patterns. Each pattern conveys market sentiment or potential price movement. Traders utilize these patterns for informed decisions on entry, exit, and risk management, enhancing their ability to interpret price action effectively.
Do Professional Traders Use Candlestick Patterns?
Do professional traders use candlestick patterns? Yes, they rely on these patterns to gauge market sentiment and forecast price movements accurately. Mastery of advanced patterns enhances trading strategies, combining them with other indicators for optimal results.
Conclusion
In conclusion, mastering these advanced candlestick patterns can give you a leg up in the ever-changing world of trading. By analyzing the Island Reversal, Hook Reversal, San-Ku, Kicker, and Hikkake patterns, you can anticipate market shifts and make informed decisions.
Remember, the early bird catches the worm – stay ahead of the curve and watch your profits soar. Keep honing your skills and stay sharp in the game of technical analysis.