
You may have noticed that bearish candlestick patterns hold significant weight in technical analysis. Studies show that these patterns can be reliable indicators of potential downtrends.
As you explore the intricacies of these patterns, understanding their nuances and implications becomes paramount in your trading strategy. By recognizing the subtle signals within each candlestick formation, you can gain a deeper insight into market sentiment.
This insight can potentially enhance your ability to navigate volatile market conditions.
Bearish Hanging Man Pattern
The Bearish Hanging Man pattern signals potential weakness in an uptrend, making it a crucial indicator for traders analyzing market trends.
This bearish reversal pattern is identified by a small real body, a long lower shadow, and the absence of an upper shadow. When this pattern emerges, traders often consider entering a short position as it indicates a possible trend reversal.
It's vital to be attentive to the Bearish Hanging Man pattern as it can signify a forthcoming price drop in the market. By recognizing this pattern early on, traders can position themselves strategically to capitalize on potential market movements and protect against losses in an uptrend.
Bearish Shooting Star Pattern
Signaling a potential price reversal at the end of an uptrend, the Bearish Shooting Star pattern is a one-day candlestick pattern that traders closely monitor for its implications on market direction.
This pattern, with a small real body near the low of the candle and a long upper shadow, indicates selling pressure. It suggests a potential trend change from bullish to bearish.
To confirm the Bearish Shooting Star pattern, traders often wait for follow-through selling in the next trading session. This confirmation is crucial for considering entry into short positions as the pattern hints at a potential reversal in the market trend.
Keep a close eye on this pattern for insights into possible shifts in market sentiment.
Bearish Engulfing Pattern
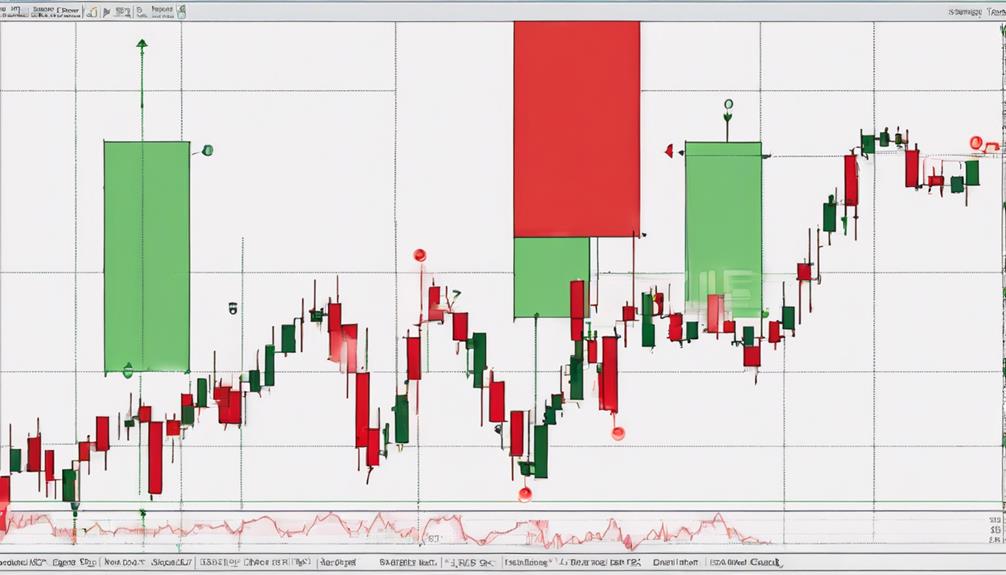
Analyzing the Bearish Engulfing pattern in technical analysis reveals a two-candlestick formation indicating a strong shift in market sentiment from bullish to bearish. This pattern suggests a potential reversal in an uptrend, making it a reliable signal for traders to enter short positions and anticipate a price decline.
The second red candle completely engulfs the prior green candle, emphasizing the bearish momentum. The larger the red candle relative to the green one, the more significant the bearish signal is considered.
Traders often look for confirmation from other technical indicators or patterns to validate the Bearish Engulfing pattern before making trading decisions. Remember, the Bearish Engulfing pattern is a crucial tool for identifying potential downtrends and taking advantage of market movements.
Evening Star Pattern
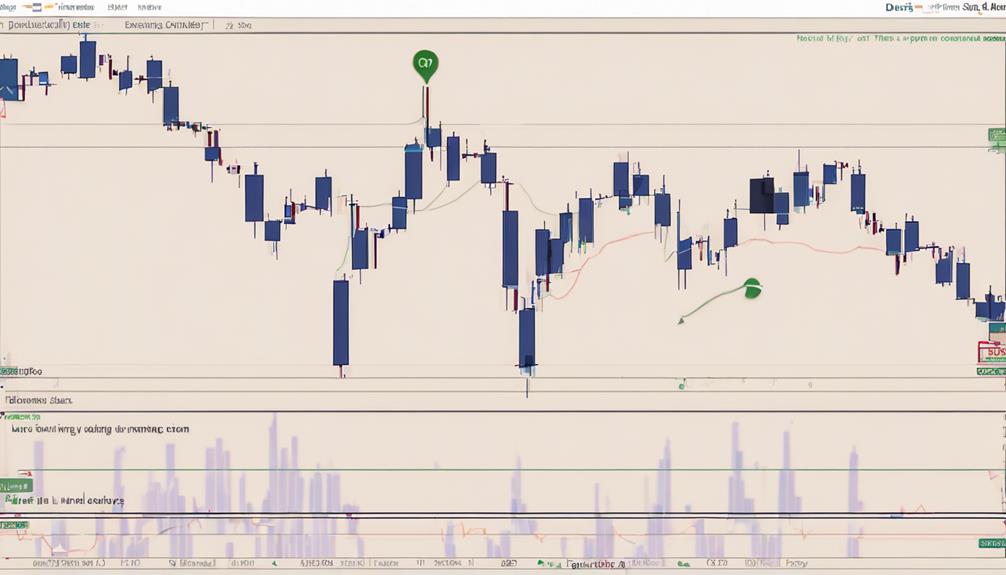
Amidst technical analysis, the Evening Star pattern emerges as a three-candlestick formation indicating a potential shift in market sentiment from bullish to bearish. This pattern typically appears at the top of an uptrend, signaling a possible trend reversal towards a downtrend. Key aspects of the Evening Star pattern include:
- The first candlestick is bullish, showing ongoing buying pressure.
- The second candlestick forms a small body or doji, indicating indecision in the market.
- The third candlestick is bearish with a close below the midpoint of the first candle, suggesting a weakening of bullish momentum.
Traders often use confirmation signals such as lower closes to validate this pattern, considering short positions or adjusting stop-loss levels in anticipation of a downtrend.
Three Black Crows Pattern
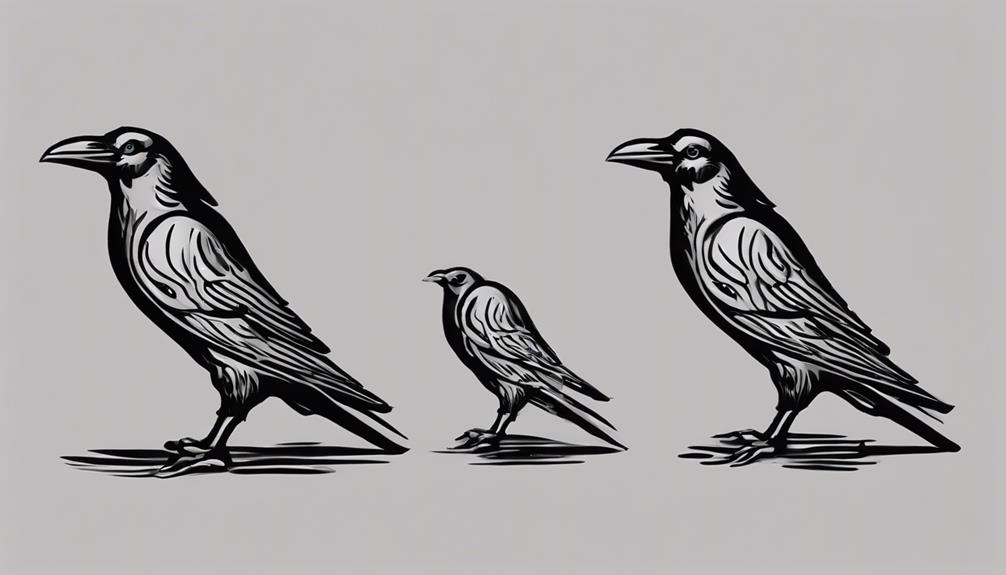
The Three Black Crows pattern is identified by three consecutive long bearish candles, each opening higher than the previous day's close and closing lower than the previous day's close. This pattern signifies a strong downtrend, indicating three days of continuous selling pressure in the market.
Traders often interpret the Three Black Crows pattern as a signal for a bearish reversal, prompting them to consider entering short positions. To enhance the pattern's reliability, traders may complement it with volume analysis and other technical indicators to confirm the potential price reversal.
When spotted on a price chart, the Three Black Crows pattern serves as a valuable tool for traders seeking to capitalize on bearish market conditions efficiently.
Are Bearish Candlestick Patterns Considered as Top Candlestick Patterns in Technical Analysis?
Bearish candlestick patterns in technical analysis are often considered as top signals for potential market reversals. Identified by various formations such as the hanging man or evening star, these patterns indicate a shift in market sentiment from bullish to bearish, making them crucial indicators for traders and investors.
Frequently Asked Questions
What Is the Best Bearish Candlestick Pattern?
When looking for the best bearish candlestick pattern, consider your strategy and risk tolerance. Patterns like Hanging Man, Dark Cloud Cover, and Bearish Engulfing are popular. Confirm signals with other indicators for effective trading decisions.
What Is the Most Successful Candlestick Pattern?
When identifying candlestick patterns, the most successful one is the Bearish Engulfing pattern. It signals a potential downtrend after an uptrend, providing traders with a signal to consider short positions and anticipate price declines.
What Is the 3 Candle Rule?
To understand the 3 candle rule, observe three consecutive candlesticks for potential trend reversals. Analyze specific patterns within these candles to make informed trading decisions and enhance strategies. Confirm signals from individual patterns for accuracy.
How Do You Read Bearish Candlestick Patterns?
When reading bearish candlestick patterns, observe the candle's body, wicks, and closing price relative to the previous candle. Look for patterns like the Hanging Man or Dark Cloud Cover. Confirm signals and consider the market trend before acting.
Conclusion
In conclusion, mastering essential bearish candlestick patterns is crucial for successful trading in technical analysis.
While some may argue that these patterns are subjective and unreliable, combining them with other indicators and risk management strategies can greatly enhance trading decisions.
By understanding the signals these patterns provide, traders can gain valuable insights into market trends and potential price reversals, ultimately improving their trading performance and profitability.