
In the dynamic world of trading, volatility indicators serve as crucial tools for navigating the complexities of financial markets. These indicators offer traders a nuanced understanding of market behavior, aiding in the identification of potential opportunities and risks.
By incorporating volatility indicators into their analysis, traders can gain a competitive edge in their decision-making process and adapt more effectively to changing market conditions. The significance of volatility indicators lies in their ability to provide insights that go beyond mere price movements, allowing traders to develop more robust strategies and optimize their trading performance.
Importance of Volatility Indicators
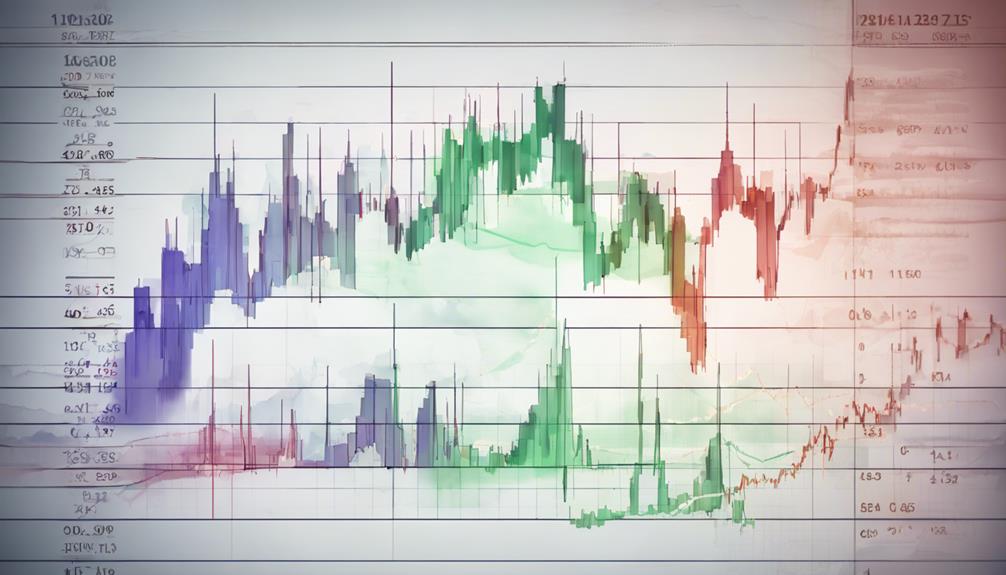
Volatility indicators play a crucial role in the realm of trading by providing traders with essential tools to evaluate and respond to market risk effectively. These indicators, such as Bollinger Bands, Average True Range (ATR), and Donchian Channel, offer insights into the market's volatility, helping traders gauge the potential price fluctuations within a specific timeframe. By analyzing the high and low points of price movements, volatility indicators assist in identifying the market's trading range and potential breakouts.
Bollinger Bands, for example, consist of a simple moving average and two standard deviations plotted above and below the average. When the price reaches the upper band, it may indicate overbought conditions, while hitting the lower band could signal oversold conditions. ATR, on the other hand, quantifies market volatility by measuring the price's range between high and low points. Understanding these indicators equips traders with the necessary information to make informed decisions, manage risks effectively, and capitalize on trading opportunities within the market.
Role in Trading Strategy Development

In the context of refining trading methodologies, the utilization of volatility indicators serves as a cornerstone in enhancing the precision and effectiveness of decision-making processes within the financial markets.
Volatility indicators play a crucial role in developing robust trading strategies by providing valuable insights into market volatility levels, guiding traders in determining optimal entry and exit points based on the degree of price fluctuations, and aiding in identifying potential market reversals or breakouts.
Understanding how to interpret volatility indicators such as the Average True Range (ATR) is essential for traders to make informed trading decisions and adjust their strategies according to the prevailing market conditions.
Impact on Risk Management
Enhancing risk management practices in trading requires a deep understanding and effective utilization of volatility indicators to navigate market fluctuations and optimize decision-making processes. Volatility indicators such as Average True Range (ATR) and Bollinger Bands play a crucial role in assessing and managing risks by providing valuable insights into market volatility levels. These indicators help traders in setting appropriate stop-loss levels and determining optimal position sizes based on the prevailing market conditions. By incorporating volatility indicators into risk management strategies, traders can adapt more effectively to changing market conditions and mitigate potential losses.
Moreover, a thorough understanding of volatility indicators enhances decision-making processes, enabling traders to make more informed choices regarding their trades. By utilizing these indicators effectively, traders can improve their risk-adjusted returns and overall trading performance. Therefore, integrating volatility indicators into risk management practices is essential for traders looking to navigate the dynamic nature of the financial markets with greater precision and confidence.
Enhancing Market Analysis
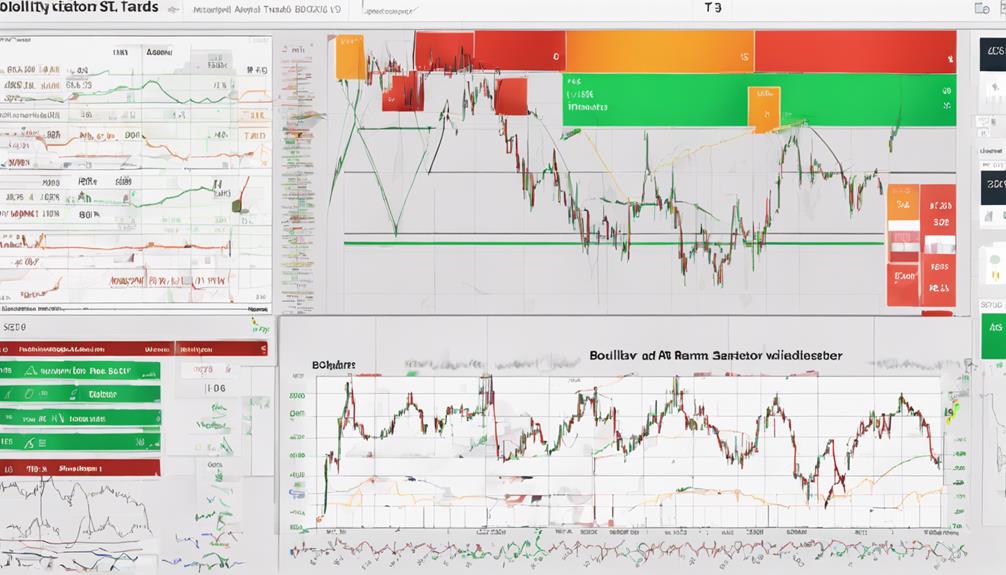
Market analysis is significantly enhanced by incorporating volatility indicators like Bollinger Bands and ATR, providing traders with valuable insights into price movements and trend changes. These indicators play a crucial role in helping traders navigate the dynamic nature of the market.
- Identifying High and Low Volatility: Volatility indicators such as Bollinger Bands and ATR assist in recognizing periods of high and low volatility, enabling traders to adjust their strategies accordingly.
- Facilitating Informed Decisions: By using volatility indicators, traders can make informed decisions based on the analysis of market fluctuations and potential trend changes.
- Improving Trading Efficiency: Incorporating volatility indicators in market analysis enhances trading efficiency by allowing traders to react promptly to changing market conditions.
Practical Application in Trading
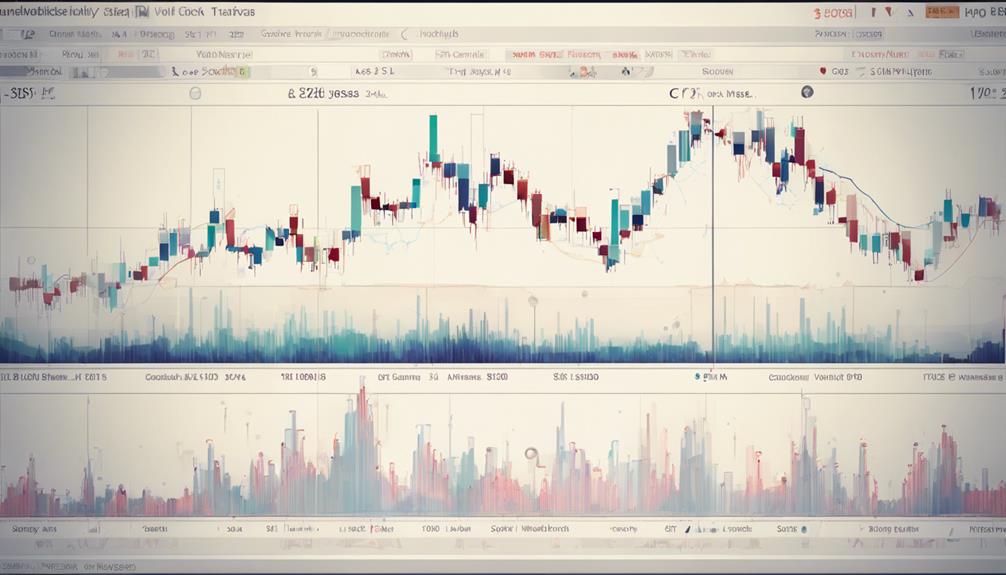
Incorporating volatility indicators like Bollinger Bands, ATR, and Donchian Channel is crucial for enhancing market analysis and making informed trading decisions. Practical application in platforms like StockEdge improves stock selection processes for traders.
Renko charts play a vital role in filtering out price noise and enhancing trend visualization, particularly beneficial in trending markets. When combined with other indicators, Renko charts can significantly improve trading signals and accuracy, provided the appropriate brick size settings are utilized.
For successful factor investing, continuous monitoring and rebalancing are imperative to capitalize on market opportunities effectively. On the other hand, mastering swing trading strategies requires ongoing learning and adaptation to market conditions.
What Are the Key Benefits of Using Volatility Indicators for Trading, Particularly for Beginners?
Volatility indicators for beginners can provide valuable insights into market fluctuations, helping traders make informed decisions. These tools can help identify price trends, predict potential reversals, and determine optimal entry and exit points. By utilizing volatility indicators, beginners can better navigate the dynamic and unpredictable nature of the financial markets.
Frequently Asked Questions
Why Is Volatility Important in Trading?
Volatility is crucial in trading as it reflects price fluctuations, indicating market risk levels. Traders leverage volatility to adjust strategies, predict trends, and pinpoint entry/exit points. Understanding volatility is fundamental for informed decision-making and risk management.
What Is the Need of Volatility Measurement?
Measuring market volatility is imperative for informed decision-making in trading. It enables traders to gauge risk levels, anticipate price movements, and adjust strategies accordingly. Understanding volatility aids in setting appropriate stop-loss levels and position sizes.
How Do You Use Volatility Indicator in Trading?
Volatility indicators, like Bollinger Bands and ATR, are utilized in trading to gauge market price fluctuations. They aid in identifying optimal entry and exit points, adapting strategies to market conditions, and enhancing risk management by providing insights into market volatility.
What Is the Importance of Volatility Index?
The importance of the Volatility Index lies in its ability to reflect market sentiment and risk levels accurately. Investors rely on VIX values above 30 to indicate heightened market volatility, providing crucial insights for informed decision-making.
Conclusion
In conclusion, volatility indicators play a crucial role in trading by providing valuable insights into market fluctuations. They guide strategy development, enhance risk management, and improve market analysis. Their practical application in trading allows for informed decision-making and effective risk mitigation.
Overall, understanding and utilizing volatility indicators are essential for traders to navigate the complexities of the market and achieve success in their trading endeavors.