
If you've heard the saying 'the trend is your friend,' then you already understand the importance of following market trends in trading.
When starting out, having the right indicators can make all the difference. Imagine having access to a set of tools that can guide your decisions and potentially lead to more successful trades.
These 5 best trend-following indicators are not just for experts but are specifically tailored for beginners like yourself, seeking a solid foundation in the world of trading.
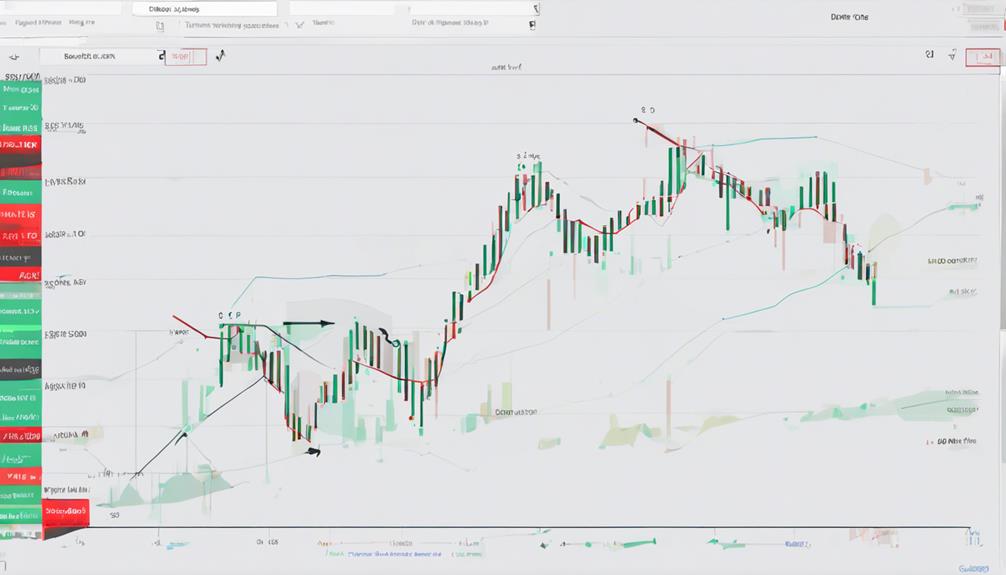
Moving Averages Overview
Moving averages, integral tools in market analysis, offer crucial insights into trend directions for traders and investors alike. These indicators are fundamental in trend-following strategies, aiding in the identification of potential entry and exit points based on price trends.
The exponential moving average and volume-weighted moving average are noteworthy variations that provide different perspectives on price movements over time. By incorporating moving averages into technical analysis, individuals can gain a clearer understanding of market trends and make informed decisions regarding their positions.
Whether you're a novice or an experienced trader, mastering the nuances of moving averages can significantly enhance your ability to interpret market dynamics and improve the timing of your trades.
MACD Indicator Explained
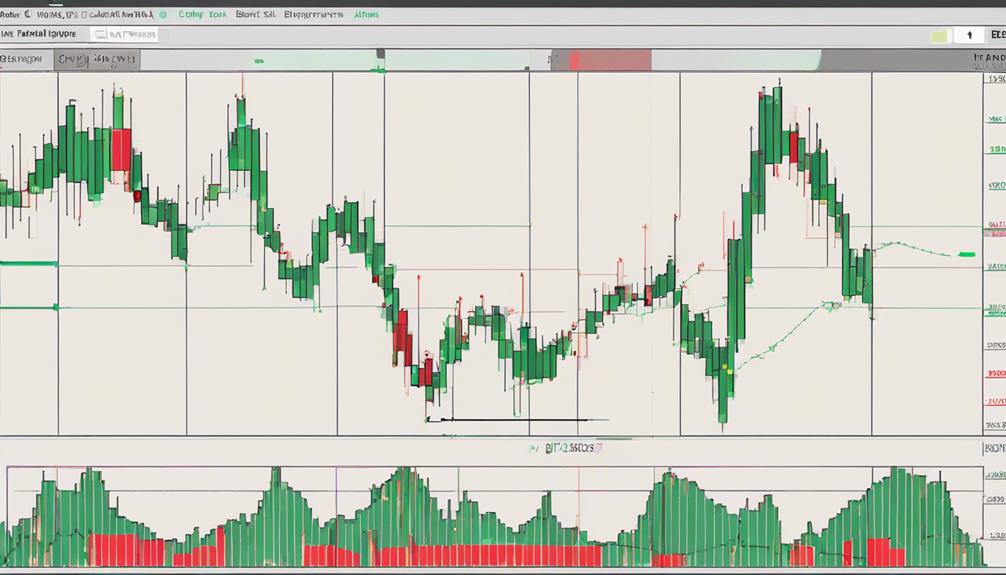
Transitioning from analyzing moving averages, the MACD indicator uses exponential moving averages to effectively capture market momentum. It consists of the MACD line, signal line, histogram, and zero line for comprehensive trend analysis.
The signal line in MACD provides reversal signals for informed trading decisions. When the MACD line is above zero, it indicates a bullish market, while below zero suggests a bearish market sentiment.
Traders often combine the MACD indicator with other tools for more accurate trend analysis and trading signals. By understanding how the MACD indicator functions in trend analysis, traders can better identify potential entry and exit points in the market.
On Balance Volume (OBV) Basics
When delving into the realm of market analysis, understanding the basics of On Balance Volume (OBV) becomes essential for grasping the flow of volume dynamics within a security.
OBV is a momentum indicator that utilizes volume to showcase the volume movement in and out of a security. Calculated cumulatively based on both volume and price changes, OBV provides a unique perspective on market dynamics.
An advancing OBV line indicates a strong trend, presenting potential buying opportunities. Conversely, a declining OBV line suggests bearish control in the market, signaling potential selling opportunities.
Therefore, OBV serves as a valuable tool for confirming price trends, evaluating market movements, and identifying favorable entry and exit points in the market.
Understanding Relative Strength Index (RSI)
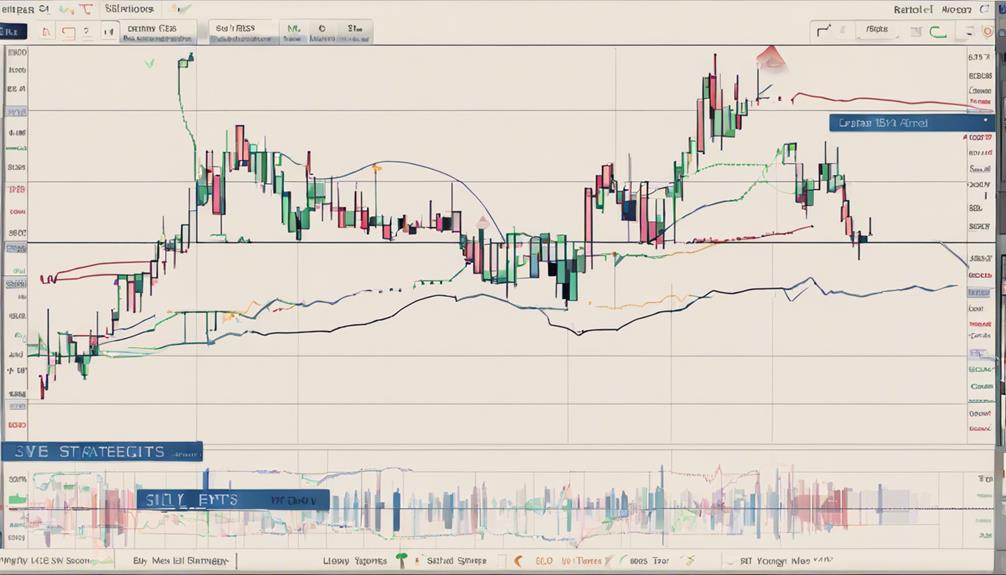
To further enhance your understanding of market dynamics and expand your toolkit for analyzing securities, it's crucial to grasp the concept of the Relative Strength Index (RSI).
RSI is a momentum oscillator that compares the magnitude of recent gains to recent losses. It ranges from 0 to 100, with readings above 70 indicating overbought conditions and below 30 signaling oversold conditions. Divergence between RSI and price movements can hint at potential trend reversals.
Traders utilize RSI to gauge the strength of price movements and to confirm trends. By incorporating RSI along with other indicators, traders can make more informed trading decisions based on the magnitude of recent gains.
Understanding RSI can empower you to navigate market trends effectively.
Introduction to Donchian Channel
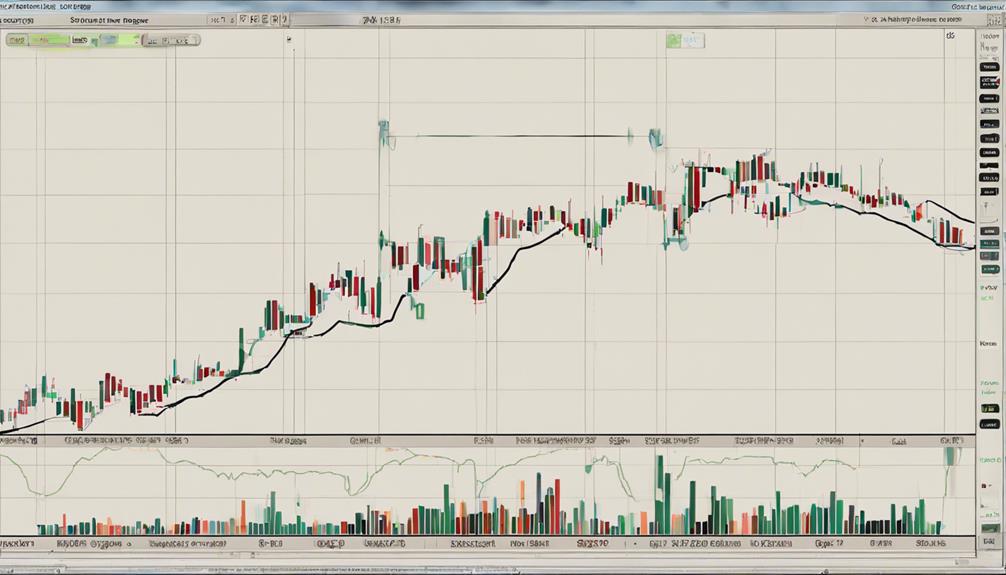
The Donchian Channel, a trend-following indicator created by Richard Donchian in the mid-20th century, utilizes upper and lower bands derived from the highest high and lowest low prices over a specified period, typically 20 bars.
When using the Donchian Channel, you can benefit from:
- Entry signals based on breakouts above the upper band or below the lower band.
- Identification of market trends and potential reversal points by focusing on price extremes.
- Filtering out false signals by combining the Donchian Channel with other technical indicators for more accurate trend analysis.
What Are the Best Trend Following Indicators for Beginners to Learn and Use?
When it comes to reading trend following indicators, beginners should focus on simple and effective tools like moving averages, the relative strength index (RSI), and the MACD. These indicators can help beginners identify trends and make informed decisions when trading in the financial markets.
Frequently Asked Questions
What Is the Best Indicator for Beginners?
For beginners, the best indicator is the Simple Moving Average (SMA). It helps identify trend direction and reduce market noise. SMA calculates average price over a period, making it easy to understand and implement entry and exit points based on trend reversals.
What Is the Best Indicator for Trend Trading?
For trend trading, the best indicator is the Moving Average Convergence Divergence (MACD). It effectively captures market momentum and offers valuable insights into trend direction changes. Traders rely on its signal line for reversal signals.
What Is the Best Trend-Following Strategy?
To excel in trend-following, focus on identifying and riding established market trends. Embrace disciplined execution and leverage reliable indicators for confirming trends. Success hinges on aligning trades with prevailing momentum. Stay sharp and proactive.
What Is the Best Indicator for Entry?
For the best indicator for entry, look at Moving Average Convergence Divergence (MACD). It offers clear signals when the MACD line crosses the signal line, indicating potential trade opportunities. Combine MACD with other indicators for confirmation.
Conclusion
In conclusion, incorporating these five trend-following indicators into your trading strategy can greatly enhance your ability to identify trends, momentum, volume flow, and trend strength. With their help, you can navigate the complexities of the market with ease and confidence.
These indicators are like a treasure map leading you to potential profits, guiding you through the turbulent waters of trading. Start implementing them today and watch your trading journey reach new heights!