
When navigating the intricate world of trading, having a solid understanding of trend following indicators is paramount. You've dipped your toes into Moving Averages and MACD, but what about the other key players in the game?
Let's explore how these indicators can elevate your trading strategies and help you navigate the dynamic landscape of the market with precision and confidence.
Moving Averages
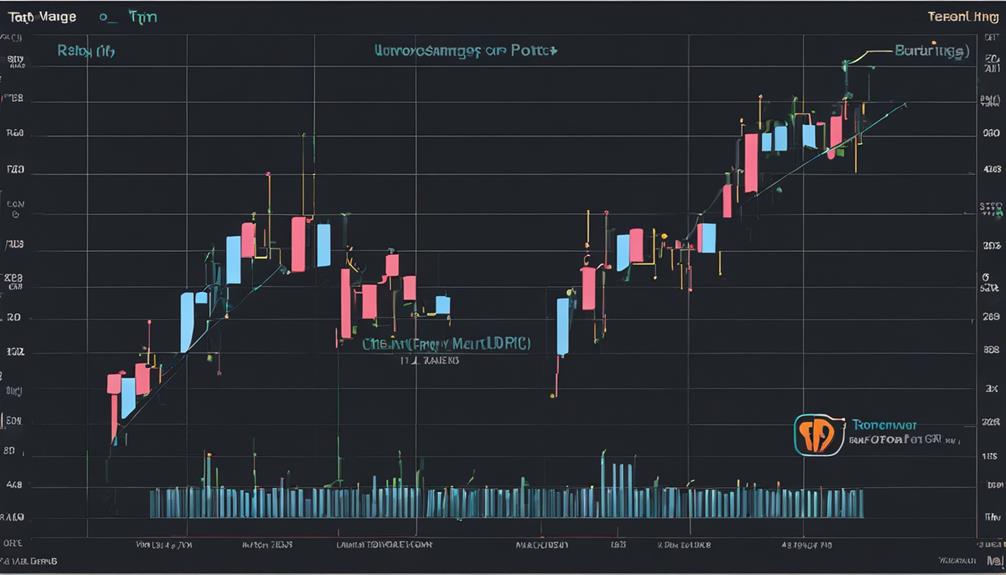
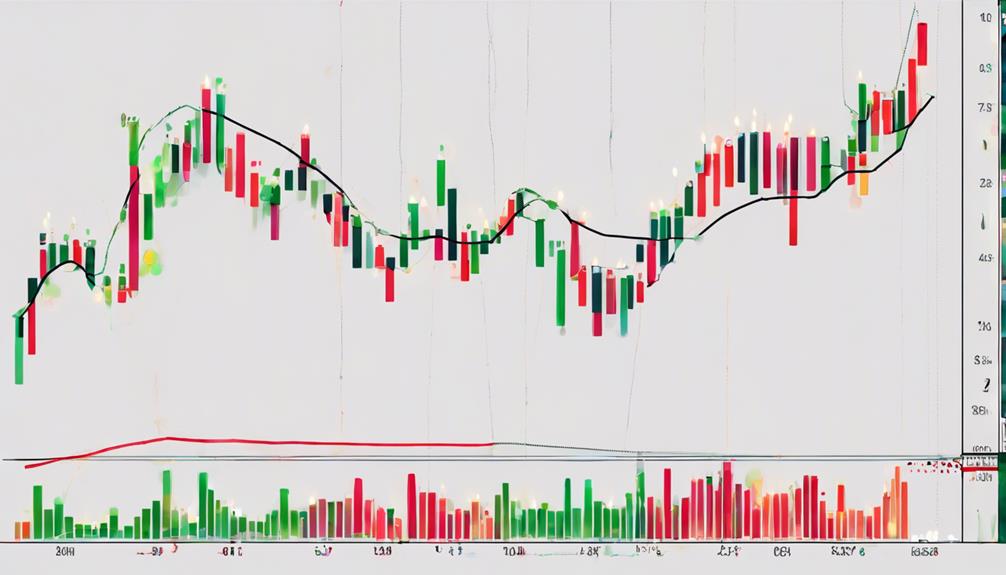
Moving Averages, a fundamental tool in technical analysis, provide crucial insights into market trends by smoothing out price fluctuations over a specific period of time. They help determine trend direction by showing the average price of an asset over a chosen timeframe.
The use of different types such as exponential moving averages and volume-weighted moving averages offers flexibility in analyzing price trends. These indicators offer a clear visual representation of how an asset's price is moving, making it easier to spot potential buy signals.
Despite the advancements in trading technology, moving averages maintain enduring relevance in technical analysis due to their ability to filter out noise and highlight significant price movements.
Moving Average Convergence Divergence (MACD)
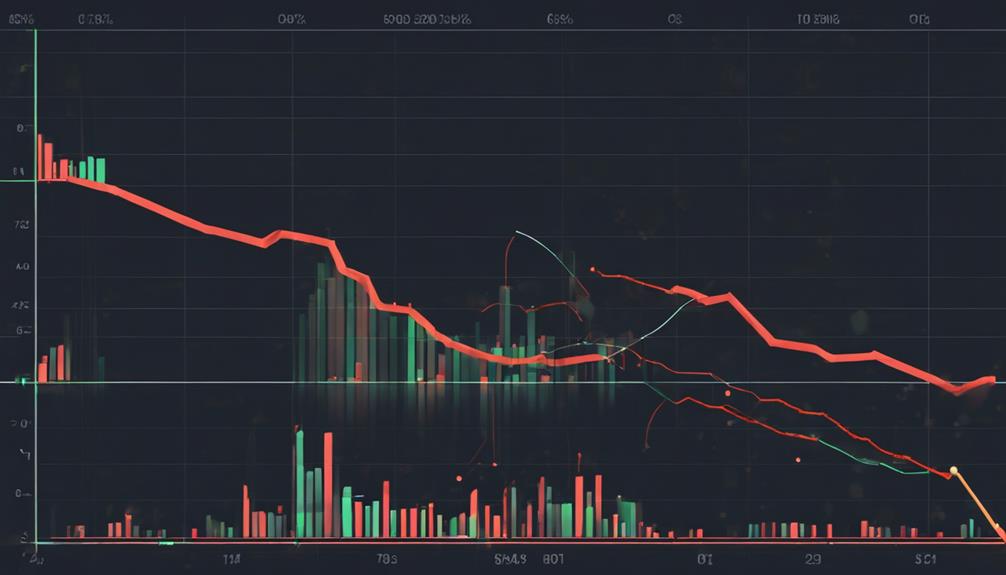
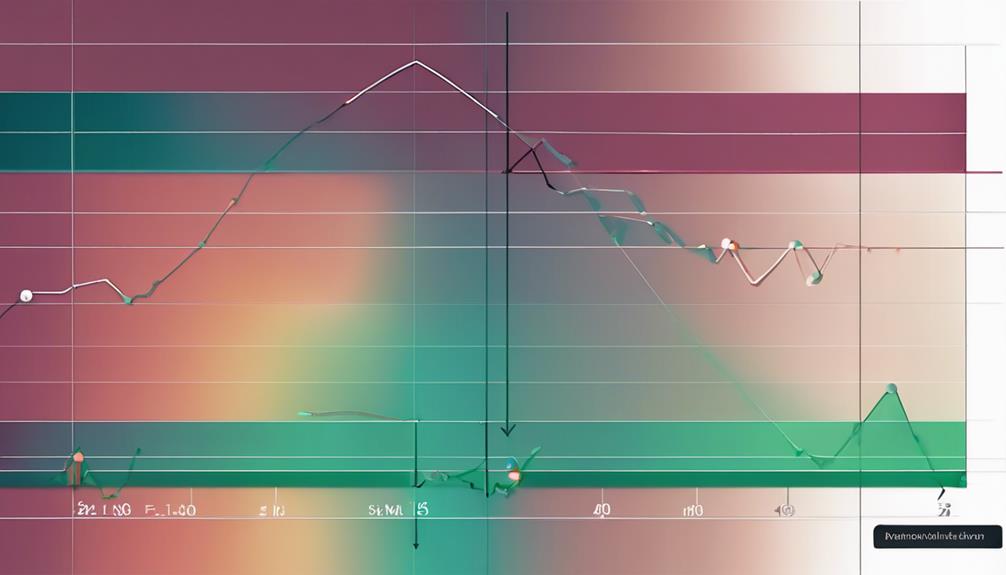
Analyzing price movements through exponential moving averages, the Moving Average Convergence Divergence (MACD) indicator is a powerful tool for trend-following momentum analysis. Comprising the MACD line, signal line, and histogram, it offers valuable insights into market direction.
Crossovers between the MACD line and signal line are key signals for potential buy or sell opportunities. A bullish market sentiment is indicated when the MACD line is above zero, while below zero suggests a bearish outlook. Traders widely use MACD to detect trend shifts, validate market momentum, and generate trade signals efficiently.
On Balance Volume (OBV)
The On Balance Volume (OBV) indicator, a momentum tool that utilizes volume to confirm price trends, plays a crucial role in assessing market dynamics. Here are some key points to deepen your understanding of OBV:
- OBV calculates based on cumulative volume flow in and out of a security.
- A rising OBV line indicates strong buying pressure, confirming an uptrend.
- Conversely, a falling OBV line signals selling pressure, validating a downtrend.
- OBV helps traders evaluate the strength of price trends by analyzing volume changes, providing insights into market sentiment and potential future price movements.
Relative Strength Index (RSI)
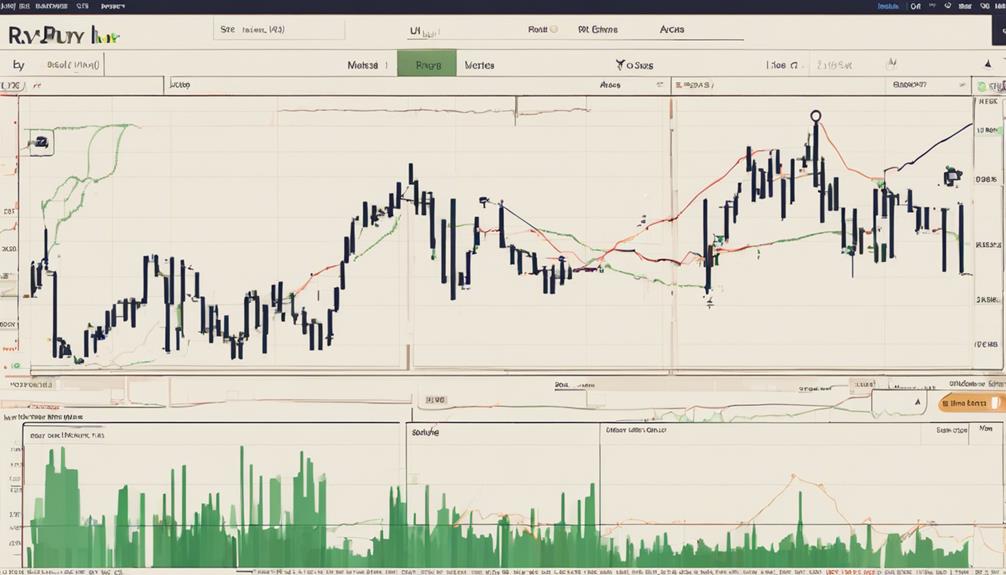
Utilize the Relative Strength Index (RSI) to gauge the speed and magnitude of price movements on a scale from 0 to 100. RSI values above 70 suggest overbought conditions, potentially indicating an upcoming price reversal to the downside.
Conversely, readings below 30 signal oversold conditions, hinting at a potential price reversal to the upside. Divergence between RSI and price action can serve as a crucial signal for a trend reversal. Traders commonly combine RSI with other indicators to confirm trend strength and identify possible entry/exit points.
Donchian Channel
To define market trends and signal entry points based on 20-bar highs and lows, consider implementing the Donchian Channel invented by Richard Donchian. The Donchian Channel consists of upper and lower bands that help identify potential breakouts in the market.
Traders often look for a breakout above the upper band or below the lower band as entry signals. However, to enhance the effectiveness of this indicator, additional filters are commonly applied to reduce false signals.
Parabolic SAR
When considering the Parabolic SAR indicator, you should focus on its SAR calculation method, which determines the placement of the dots on the chart. Understanding the interpretation of the signals generated by the dots above or below the price action is crucial for making informed trading decisions.
Implementing Parabolic SAR in your trading strategy can help you effectively trail stops and capture trends, enhancing your risk management approach.
SAR Calculation Method
The Parabolic SAR (Stop and Reverse) calculation method places dots above or below price to indicate trend direction based on price momentum. Here are key insights regarding the SAR calculation method:
- SAR dots switch sides when a trend reverses, signaling changes in market direction.
- This method aids traders in setting trailing stops to secure profits and manage losses in trending markets.
- Traders utilize Parabolic SAR to stay within trends efficiently by adjusting stop loss levels based on SAR dots.
- The SAR calculation method serves as a vital tool for implementing trend following strategies, providing cues for potential entry or exit points.
Understanding how the SAR calculation method works can help traders make informed decisions and optimize their trading strategies effectively.
Interpretation of Signals
Interpreting signals from the Parabolic SAR indicator involves closely monitoring the dots positioned above or below price to gauge trend direction and potential entry or exit points. The dots switch sides when signaling trend reversals, offering traders valuable insights.
For entering positions, a dot below price indicates an uptrend, while a dot above signifies a downtrend. Exiting positions can be timed when the dots flip. Traders use Parabolic SAR to set trailing stops in strong trends, aiming to maximize profits and limit losses effectively.
However, in rangebound markets, this indicator may be less reliable. Overall, utilizing Parabolic SAR can assist in staying with trends by dynamically adjusting stop-loss levels as the trend progresses.
Implementing in Trading
To effectively implement Parabolic SAR in trading, consider using its trailing stop and reverse signals as key indicators for identifying trend changes and managing risk.
Here are some essential points to help you leverage Parabolic SAR effectively:
- Utilize the dots above the price in a downtrend and below the price in an uptrend to gauge the trend direction accurately.
- Set trailing stops based on the Parabolic SAR dots to stay in trending markets while safeguarding your positions.
- Watch for the dots switching sides as they indicate potential trend reversals, allowing you to adjust your trading strategy accordingly.
- Employ Parabolic SAR to capture trends effectively and prevent premature stop-outs in volatile market conditions.
Aroon
When analyzing market trends, understanding the Aroon indicator can provide valuable insights into potential trend changes and strengths based on a security's price highs and lows.
The Aroon indicator consists of two lines: Aroon up, which gauges new highs, and Aroon down, which assesses new lows. Aroon up crossing above 70 indicates a robust uptrend, while Aroon down dropping below 30 signifies a strong downtrend.
This indicator aids traders in capturing trending markets by offering clear signals for potential entry and exit points. It's particularly useful for confirming trend direction and strength when used alongside other technical indicators.
Bollinger Bands
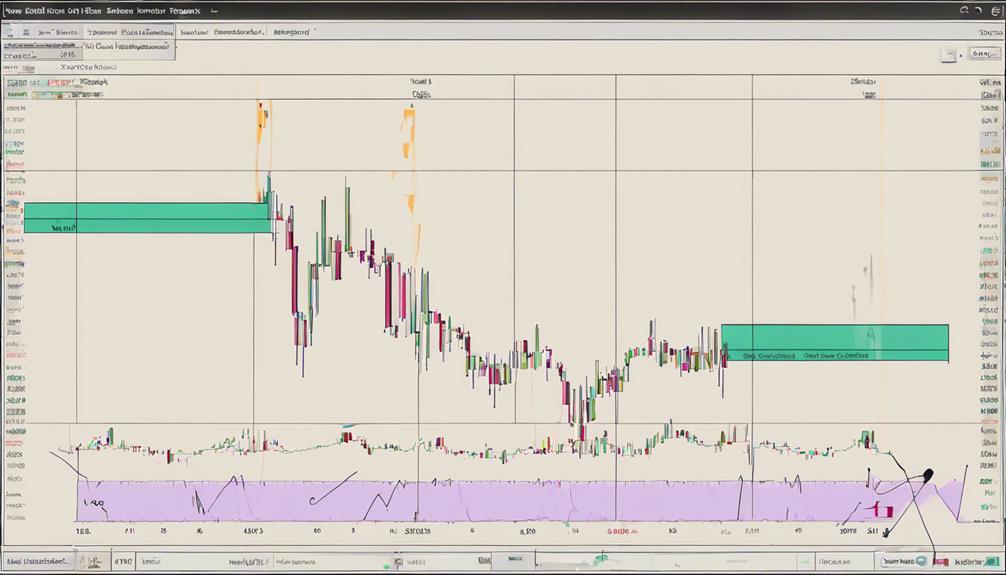
Bollinger Bands, a volatility indicator comprising upper, lower, and middle bands, are essential tools for traders seeking to analyze price movements and identify market conditions.
- Bollinger Bands are based on standard deviations of price movements, with wider bands indicating increased volatility.
- Traders use these bands to identify overbought and oversold conditions in the market.
- Price movements typically remain within the bands, but breakout signals can occur when prices move above or below the bands.
- Bollinger Bands help traders assess potential trend reversals and determine the strength of a current trend.
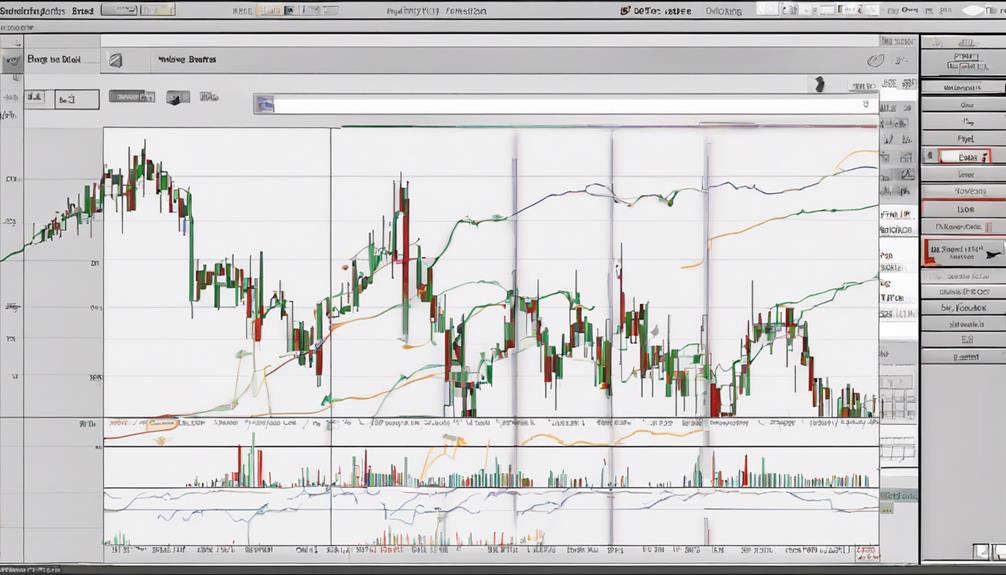
Trend Following Indicator Selection
As you move from understanding Bollinger Bands to selecting trend following indicators, prioritize those that aptly capture market momentum and trend direction for your trading strategies.
Key indicators like moving averages, MACD, RSI, and OBV are commonly used in trend following strategies due to their ability to signal trend direction and market momentum effectively.
When choosing indicators, consider their historical performance in providing reliable signals and their effectiveness in confirming trends. Combining multiple indicators can help confirm trends and filter out false signals, enhancing the accuracy of your trading decisions.
Select indicators that align with your trading style and risk tolerance to achieve consistent success in trend following strategies.
What Are the Key Differences Between Basic and Beginner Trend Following Indicators?
Basic trend following indicators are simple tools like moving averages, while beginner trend following indicators are slightly more complex, such as MACD or RSI. Both serve the same purpose, but the beginner ones offer more nuanced analysis. It’s important to understand how to use the best trend following indicators for trading success.
Frequently Asked Questions
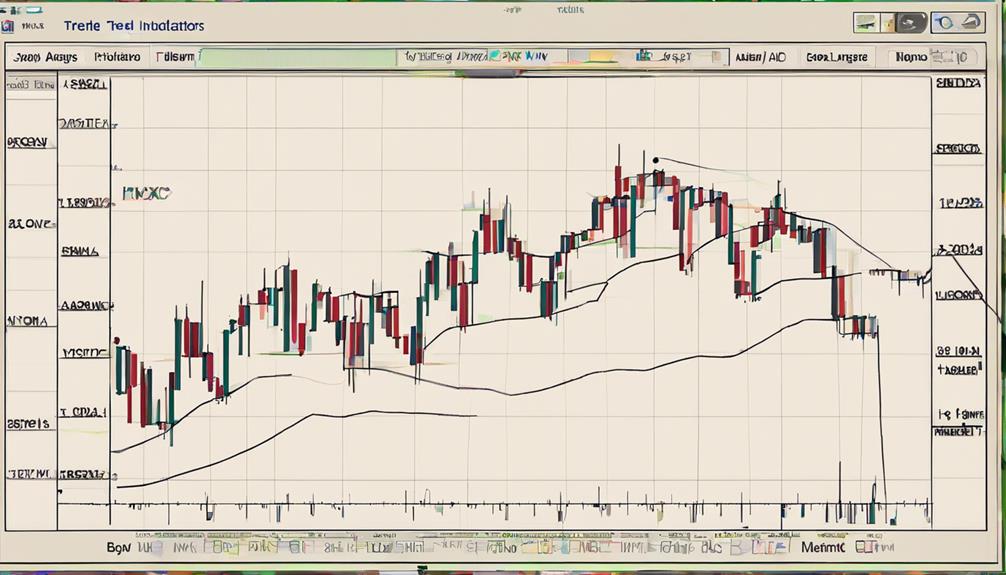
What Are the Best Trend Indicators?
To identify the best trend indicators, consider Moving Averages for trend direction, MACD for momentum, RSI for price strength, OBV for volume alignment, and Simple Moving Average for trend emergence. These indicators guide your trend trading strategy effectively.
What Is the Best Trend-Following Strategy?
To excel in trend-following, focus on spotting and riding trends rather than predicting them. Utilize technical indicators for trade decisions aligned with market momentum. Emphasize risk management and timely exits for maximum gains in your strategy.
What Is Trend-Following Indicator?
A trend-following indicator helps you identify market momentum direction by focusing on existing trends instead of predicting future prices. These tools are crucial for pinpointing entry and exit points, aiding in avoiding losses.
What Are the 4 Types of Indicators?
When trading, you should consider using Moving Averages, MACD, RSI, and OBV as they help analyze trends, momentum, and reversals. These indicators are essential tools for making informed decisions in the market.
Conclusion
Congratulations! You've now mastered the art of utilizing the top 10 trend following indicators to navigate the unpredictable waters of the market.
Like a skilled captain steering a ship through stormy seas, these indicators will guide you towards profitable opportunities and help you avoid potential pitfalls.
Embrace these tools as your compass, and watch as you confidently sail towards success in your trading endeavors.
Smooth sailing ahead!