
The On-Balance Volume (OBV) indicator stands as a revered tool in the realm of technical analysis, renowned for its ability to decipher market sentiment through volume trends. As traders navigate the intricate landscape of financial markets, OBV serves as a compass, guiding them towards potential opportunities and pitfalls.
Its calculation method and nuances offer a unique perspective on market dynamics, shedding light on the underlying forces that drive price movements. Understanding the intricacies of OBV could unveil a treasure trove of insights for traders seeking to navigate the markets with precision and foresight.
Definition and Purpose of OBV
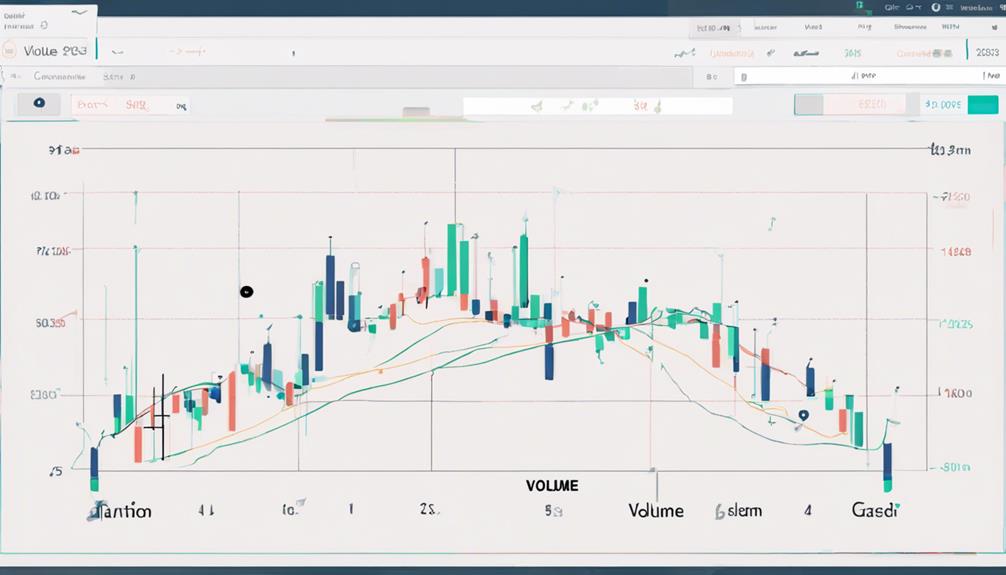
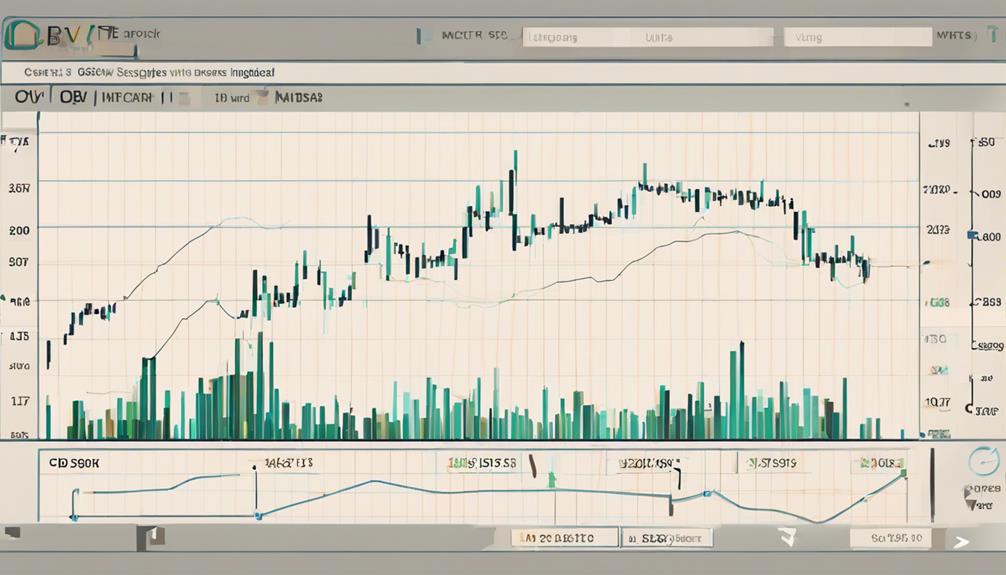
On-Balance Volume (OBV) is a technical analysis indicator designed to measure the cumulative buying and selling pressure in a financial security. It is based on the concept that volume precedes price movement. By analyzing the relationship between volume and price trends, OBV helps traders and analysts gauge the market sentiment and potential price changes. The indicator focuses on tracking the flow of volume in and out of a security over time. OBV calculations involve adding volume on days when the price closes higher and subtracting volume on days when the price closes lower. This process results in a cumulative total that either confirms or contradicts the current price trend.
OBV assists traders in identifying potential trend reversals and confirming the strength of a current trend. When OBV aligns with price movements, it suggests a sustainable trend. Higher peaks and troughs in both price and OBV indicate a probable upward trend, while lower peaks and troughs suggest a likely downward trajectory. Monitoring the OBV line alongside price movements provides insights into accumulation (buying pressure) and distribution (selling pressure) within the market.
Calculation Method of OBV
The calculation method of the On Balance Volume (OBV) indicator involves adding volume on up days and subtracting volume on down days based on the security's closing price. The OBV indicator is a valuable tool for trend analysis in the financial markets. Here are some key points regarding the calculation method of OBV:
- Volume on up days is added to OBV.
- Volume on down days is subtracted from OBV.
- OBV remains unchanged when today's closing price equals yesterday's closing price.
- The focus of OBV is on the direction of the line for trend analysis.
- Rising OBV during a trading range suggests accumulation and a potential upward breakout, while falling OBV indicates distribution and a potential downward breakout.
Understanding the calculation method of OBV is crucial for traders and investors looking to interpret volume trends and make informed decisions based on the accumulation and distribution signals it provides.
Interpreting OBV Trends
When analyzing OBV trends, it is crucial to observe the relationship between volume and price dynamics for insightful market interpretations. Rising OBV during a trading range indicates accumulation, suggesting a potential upward breakout in price movements. Conversely, falling OBV during a trading range hints at distribution patterns and potential downward breakouts in the market.
Negative divergence occurs when price reaches higher peaks while OBV fails to follow, signaling a potential stall in an upward trend. On the other hand, positive divergence is observed when price hits lower troughs while OBV fails to follow, indicating a potential stall in a downward trend.
Benefits of Using OBV Indicator
Analyzing the benefits of incorporating the OBV indicator into market analysis reveals valuable insights into buying and selling pressure dynamics.
- Used in technical analysis, the OBV indicator is based on volume flow, providing a unique perspective on how volume changes relate to price movements.
- The OBV indicator can give positive signals for traders to make informed decisions on when to buy or sell based on the volume-price relationship.
- It helps in identifying trends by focusing on the direction of OBV rather than its specific values, aiding in spotting potential market movements.
- Monitoring OBV during trading ranges can indicate accumulation or distribution patterns, assisting traders in anticipating breakout or breakdown scenarios.
- By observing higher peaks and troughs in both price and OBV, traders can infer a probable upward trend, while lower peaks and troughs may suggest a potential downward trend.
Implementing OBV in Trading Strategy
One effective approach to incorporating the OBV indicator into trading strategies involves utilizing its insights on volume changes to assess market sentiment and potential trends.
The On-Balance Volume (OBV) is a technical indicator that combines price and volume to provide a clear picture of buying and selling pressure. Traders often focus on the direction of OBV rather than its specific value, using it to confirm trends or identify potential reversals in the market.
By tracking OBV trends, traders can make informed decisions on market entries and exits, utilizing the indicator as a key tool for daily stock market timing.
It is important to note that OBV uses volume flow, where rising prices with increasing OBV indicate strong buying pressure, while falling prices with decreasing OBV suggest strong selling pressure. Traders should be cautious when OBV fails to confirm price movements, as this may signal a weakening trend.
How Does the on Balance Volume Indicator Work and What Does It Measure?
The importance of balance volume indicator lies in its ability to measure the strength of a price move. By tracking the volume of trades, it provides insight into whether a price movement is supported by strong buying or selling pressure. This helps traders make more informed decisions about market trends.
Frequently Asked Questions
What Does on Balance Volume Tell You?
On Balance Volume (OBV) indicates buying and selling pressure based on volume flow in relation to price movements. It adds volume on up days and subtracts on down days to track strength. The direction of OBV is crucial for interpreting potential market trends.
How Do You Trade With OBV Indicator?
To trade with the OBV indicator effectively, traders must interpret its direction to gauge market sentiment and potential trends. Utilize OBV for spotting accumulation or distribution phases, confirm breakouts, and identify divergences, aiding in informed decision-making for profitable trading strategies.
What Is the on Balance Volume Indicator in Tradingview?
The On-Balance Volume (OBV) indicator in TradingView quantifies buying and selling pressure by netting volume changes on up and down days. Traders leverage OBV's trend direction to anticipate market shifts, aiding in identifying accumulation and distribution phases.
How Reliable Is the OBV Indicator?
The reliability of the OBV indicator varies based on market conditions and the presence of sudden volume spikes. Caution is recommended during such instances to ensure accurate predictions, highlighting the need for traders to consider additional indicators for confirmation.
Conclusion
In conclusion, the On-Balance Volume (OBV) indicator serves as a valuable tool for traders to analyze volume flow and predict stock price changes. By comparing price bars and volume, traders can identify potential trends and make informed trading decisions.
The OBV indicator's calculation method, interpretation of trends, and benefits in trading strategies all contribute to its significance in the financial markets.
Overall, incorporating OBV into trading strategies can enhance market analysis and improve decision-making processes.