
Imagine navigating the intricate world of Forex trading with the clarity of a pilot guided by the Ichimoku Cloud Indicator. Discover how mastering the ten essentials outlined in this guide can elevate your trading game to new heights.
From deciphering the Kumo Cloud to unlocking the secrets of Senkou Span Lines, each component plays a vital role in deciphering market trends and making informed trading decisions.
Dive into this essential guide to unravel the power of Ichimoku Cloud Indicator and enhance your trading prowess.
Ichimoku Cloud Indicator Basics
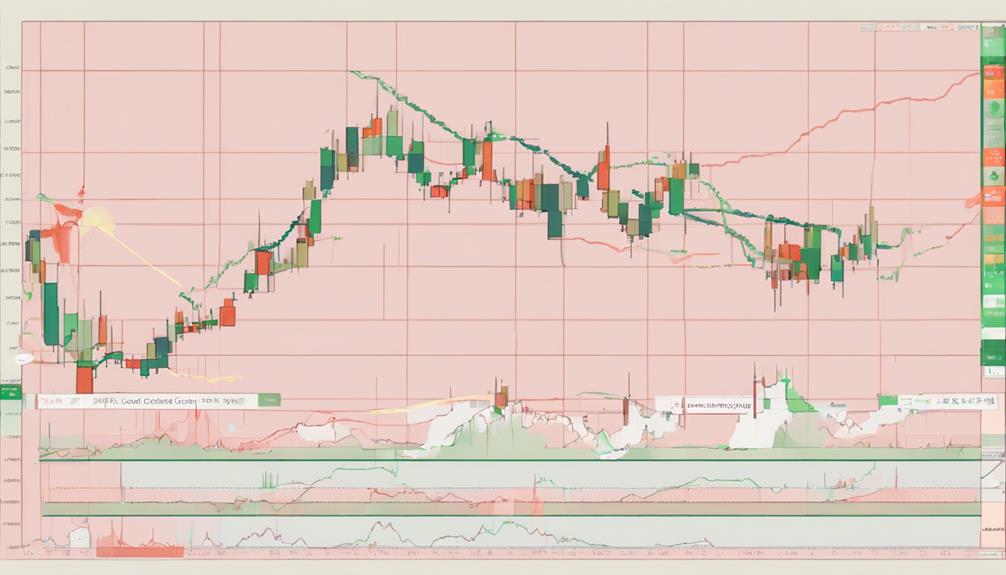
The Ichimoku Cloud Indicator serves as a vital tool for traders seeking comprehensive insights into market trends and potential trading opportunities. This technical analysis tool helps you identify support and resistance levels, determine the trend direction, and spot potential buy and sell signals based on price action.
By analyzing the cloud color and its position relative to the price, you can make informed decisions in various financial markets. Ichimoku Cloud is particularly beneficial for traders interested in medium to long-term trading strategies as it provides a holistic view of market momentum.
Understanding how to interpret the Ichimoku Cloud can enhance your trading strategies and improve your overall performance in the financial markets.
Key Components of Ichimoku Cloud
Exploring the essential components of the Ichimoku Cloud indicator provides traders with crucial insights into market dynamics and potential trading opportunities.
The Tenkan-Sen line is calculated from the midpoint of the last 9 candlesticks, offering a short-term perspective.
On the other hand, the Kijun-Sen line represents the midpoint of the last 26 candlesticks, providing a medium-term view of the market.
Chikou Span, lagging behind the price by 26 periods, aids in trend analysis.
Senkou Span A is derived from the midpoint between the Conversion Line and the Base Line, while Senkou Span B is calculated as the midpoint of the last 52 price bars.
Understanding these components is fundamental for comprehensive trend analysis using the Ichimoku Cloud indicator.
Understanding Tenkan-sen Line
Understanding the Tenkan-sen line provides traders with valuable insights into short-term market momentum and potential trend reversals. As the midpoint of the last 9 candlesticks, this line reflects short-term price movement and market sentiment within the 9-period time frame.
Traders keen on identifying trading signals often watch for crossovers between the Tenkan-sen and Kijun-sen lines, which can indicate shifts in the market trend. By comprehending the role of the Tenkan-sen line in the Ichimoku Cloud indicator, you can enhance your ability to interpret market dynamics and make informed trading decisions.
Stay tuned to delve into further analysis with the Kijun-sen line in the next subtopic.
Analyzing Kijun-sen Line
When analyzing the Kijun-sen line, focus on its calculation method. It involves the midpoint of the highest high and lowest low over the past 26 periods.
Pay close attention to Kijun-sen crossovers. They signal potential shifts in market momentum and trend direction.
Utilize the Kijun-sen line in conjunction with other Ichimoku components. This approach offers a comprehensive assessment of market conditions and trade signals.
Kijun-Sen Calculation Method
The calculation method for determining the Kijun-Sen line involves finding the midpoint between the highest high and lowest low over the previous 26 periods. When analyzing the Kijun-Sen line, consider these key points:
- It offers a medium-term outlook on trend direction.
- Traders use it to identify potential support and resistance levels.
- The Kijun-Sen line is a crucial component of the Ichimoku Cloud indicator.
- Changes in its slope and position can indicate trading opportunities.
Understanding how the Kijun-Sen line is calculated and its significance within the Ichimoku Cloud framework can provide valuable insights into market dynamics and potential future price movements.
Interpreting Kijun-Sen Crossovers
One critical aspect of analyzing the Kijun-Sen line in Ichimoku Cloud is interpreting its crossovers with the price action to gauge potential trend shifts. When the price crosses above the Kijun-Sen line, it signals a bullish trend, indicating upward momentum in the market.
Conversely, a bearish trend is signaled when the price crosses below the Kijun-Sen line, suggesting a potential downtrend. These crossovers play a crucial role in trend analysis, helping traders assess market sentiment and make informed trading decisions.
Importance of Senkou Span Lines

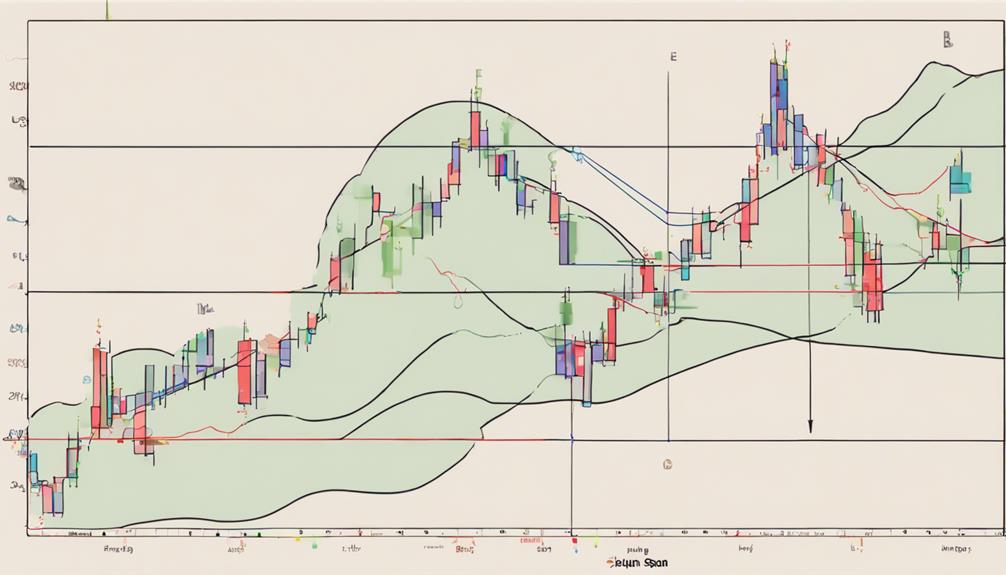
Calculating the Senkou Span lines involves averaging specific indicators and shifting them forward, providing valuable insights into future price movements. The Senkou Span lines play a crucial role in Ichimoku Cloud analysis. Here's why they're essential:
- Senkou Span A and Senkou Span B create the Kumo Cloud, representing future support and resistance levels.
- They offer forward-looking support and resistance zones, aiding in trend confirmation.
- The distance between Senkou Span A and B can help traders make informed trade decisions.
- Senkou Span lines provide a visual representation of potential price movements, guiding you in anticipating market shifts effectively.
Utilizing Chikou Span Line
When analyzing the Chikou Span Line, it is essential to consider its calculation and its significance in determining market sentiment. Understanding how the Chikou Span interacts with price movements and other Ichimoku components can provide valuable insights into potential trend shifts.
Chikou Span Calculation
To calculate the Chikou Span, you shift the closing price back 26 periods on the chart. Understanding this indicator is crucial for evaluating potential support and resistance levels based on historical price action.
Here are some key points about Chikou Span:
- Helps confirm trend signals from other Ichimoku components.
- Assists in assessing the strength of the current trend.
- Identifies potential reversal points in the market.
- Analyzing the Chikou Span's position in relation to price action is vital for making well-informed trading decisions.
Interpreting Chikou Span
Shifting back 26 periods on the chart, the Chikou Span line, representing the current closing price, serves as a key tool for traders to gauge market sentiment and validate trend signals within the Ichimoku Cloud indicator framework.
By comparing the Chikou Span to the current price, traders can discern bullish momentum if it's above the price and bearish sentiment if it's below. This component is vital for confirming trading signals from other Ichimoku components.
Acting as a lagging indicator, the Chikou Span aids in identifying potential trend reversals or continuations. Understanding how to interpret the Chikou Span can enhance your ability to make informed trading decisions based on the prevailing market sentiment and trend dynamics.
Interpreting Kumo Cloud
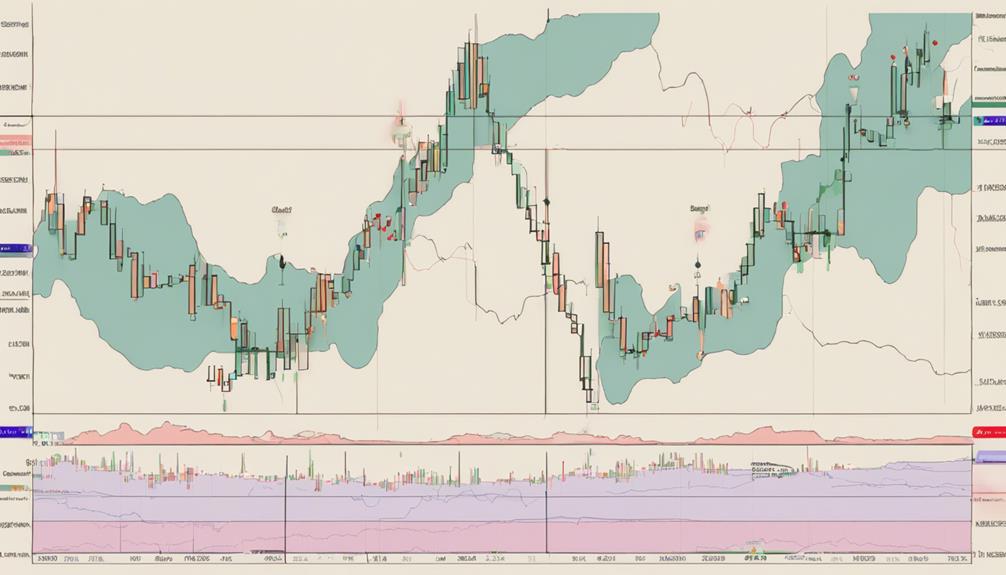
Within the realm of technical analysis, understanding the Kumo Cloud within the Ichimoku indicator is pivotal for interpreting potential future price movements. The Kumo Cloud consists of Senkou Span A and Senkou Span B, creating a shaded area on the chart. Here are some key points to consider:
- The Kumo Cloud represents future price movement and acts as support or resistance.
- A bullish signal emerges when the price is above the Kumo Cloud, signaling a potential uptrend.
- Conversely, a bearish signal occurs when the price falls below the Kumo Cloud, indicating a potential downtrend.
- The thickness of the Kumo Cloud indicates the strength of support or resistance levels, with a thicker cloud suggesting stronger levels.
Ichimoku Cloud Indicator Signals
The Ichimoku Cloud Indicator's signals play a crucial role in identifying potential price movements within the financial markets. Key components like Tenkan Sen and Kijun Sen crossovers provide insights into trend changes.
The Chikou Span reflects the current price concerning historical prices, aiding in analyzing market sentiment. Additionally, Senkou Span A and Senkou Span B create a cloud that predicts future support and resistance levels.
By observing how the price interacts with the Ichimoku Cloud, traders can anticipate potential price movements. These signals are instrumental in understanding market dynamics and forecasting potential trend changes.
Utilizing the Ichimoku Cloud Indicator's signals effectively can help traders make informed decisions based on the indicator's analysis of price movements and trend developments.
Ichimoku Cloud Trading Strategies
To successfully implement Ichimoku Cloud trading strategies, understanding key concepts like edge-to-edge cloud setups and Kumo twist signals is essential for optimizing entries and exits in the financial markets. When utilizing Ichimoku Cloud for trading, consider the following:
- Swing Trading Techniques: Utilize Kumo twist signals for capturing market trends efficiently.
- Buying Positions: Establish clear rules for buying positions based on indicator signals.
- Day Trading Approach: Follow a step-by-step strategy to maximize trading opportunities within the day.
- Tailored Strategies: Customize specific rules and techniques for different trading styles to enhance effectiveness.
Practical Tips for Using Ichimoku Cloud

For optimal utilization of the Ichimoku Cloud indicator, focus on implementing practical tips to enhance your trading strategies effectively.
Adjusting settings on the Ichimoku Cloud is crucial for accurate trend analysis and signal confirmation. Traders rely on the Kijun-Sen and Tenkan-Sen lines for trend identification, helping to determine potential buy and sell signals.
The indicator aids in identifying support and resistance levels, facilitating profitable trade entries and exits. Due to its comprehensive trend analysis capabilities, the Ichimoku Cloud is particularly beneficial for medium to long-term trading strategies.
What Are the Essential Components of the Ichimoku Cloud Indicator?
The simplified Ichimoku cloud basics include five key components: Tenkan-sen, Kijun-sen, Senkou Span A, Senkou Span B, and the Kumo. These elements provide valuable insights into support and resistance levels, trend direction, and potential trading signals. Understanding these essential components is crucial for effectively using the Ichimoku cloud indicator in trading.
Frequently Asked Questions
What Is the Best Indicator for Ichimoku Cloud?
The best indicator for Ichimoku Cloud is subjective based on your trading strategy. However, the Tenkan-Sen and Kijun-Sen lines are fundamental components. Understanding their relationship with price and the Kumo Cloud can enhance your analysis.
What Is the Best Timeframe for Ichimoku?
For Ichimoku Cloud, daily timeframe suits medium to long-term strategies. Shorter timeframes like 1-hour offer quicker signals but more noise. Longer timeframes like weekly confirm trends. Combine multiple timeframes for robust signals. Choose based on goals and risk tolerance.
What Is the Basic Ichimoku Strategy?
To understand the basic Ichimoku strategy, watch for signals when the Tenkan Sen crosses the Kijun Sen. This intersection indicates potential bullish or bearish trends, guiding your entry and exit points in the market effectively.
What Is 9 26 52 in Ichimoku?
In Ichimoku, 9, 26, 52 signify the time periods for key components. The 9-period Tenkan-Sen tracks short-term price action, the 26-period Kijun-Sen gauges medium-term trend, and the 52-period Senkou Span B offers long-term support/resistance insights.
Conclusion
In conclusion, mastering the 10 essentials of the Ichimoku Cloud Indicator can greatly enhance your trading acumen.
By understanding the basics, key components, and trading strategies, you can navigate the markets with confidence.
Remember, utilizing this powerful tool in conjunction with other technical analysis methods can provide a well-rounded approach to decision-making.
Stay sharp, stay strategic, and seize success with the Ichimoku Cloud Indicator.