
In the realm of technical analysis, the comparison between Keltner Channels and other tools such as Bollinger Bands sparks a nuanced exploration into the diverse methodologies utilized by traders.
While Keltner Channels offer insights into trend directions and reversals through a distinct blend of moving averages and volatility measurements, Bollinger Bands take a different approach by pinpointing overbought and oversold market conditions for strategic decision-making.
The subtle nuances in how these tools interpret market dynamics and price movements hold the key to unlocking a deeper understanding of their respective strengths and limitations, guiding traders towards optimal decision-making strategies.
Keltner Channels Overview
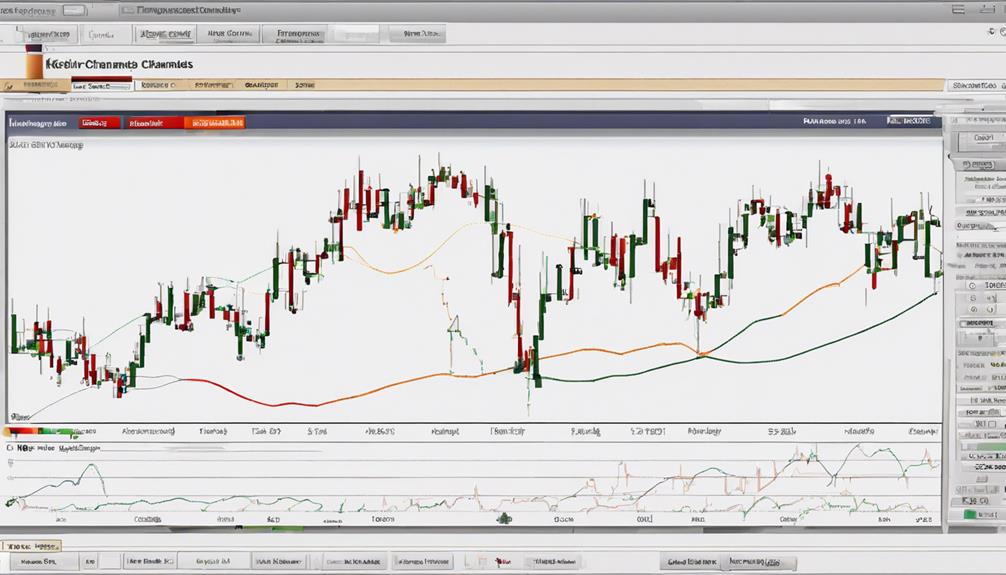
Keltner Channels, a technical analysis tool utilized in financial markets, are defined by a central line calculated from a 20-day exponential moving average. The Upper and lower channels of Keltner Channels are established using the Average True Range (ATR) over the past 20 days, reflecting the current volatility of the price range.
These channels are valuable for trend analysis, helping traders identify potential trend reversals. Compared to Bollinger Bands, Keltner Channels react less abruptly to sudden price changes due to their ATR-based calculation. The middle line in Keltner Channels offers a reference point for determining the overall trend direction.
Traders often use the width of the channels to gauge the strength of a trend; wider channels indicate higher volatility, while narrower channels suggest lower volatility. By incorporating both the exponential moving average and the ATR, Keltner Channels provide a comprehensive view of price movements, aiding in making informed trading decisions.
Bollinger Bands Explained
Bollinger Bands, a widely used technical analysis tool in financial markets, are composed of a 20-day simple moving average and upper/lower bands set at 2 standard deviations. These bands are instrumental in identifying overbought or oversold market conditions as prices touch the bands. While Bollinger Bands do not predict price direction, they offer insights into potential market shifts.
Traders often look for a squeeze in the bands as it indicates low volatility, potentially leading to increased volatility in the future. Utilized for entry and exit points, trend confirmation, and risk management in trading strategies, Bollinger Bands play a crucial role in the trading world.
- Help identify overbought or oversold market conditions
- Do not predict price direction but indicate potential market shifts
- Squeeze in the bands signals low volatility and potential future volatility increase
- Used for entry/exit points, trend confirmation, and risk management
- Widely employed in trading strategies for market analysis
Moving Average Convergence Divergence (MACD)
Moving Average Convergence Divergence (MACD) is a trend-following momentum indicator that analyzes the relationship between two moving averages of a security's price. The MACD consists of three main components: the MACD line, the signal line, and the histogram. These elements assist traders in identifying changes in the strength, direction, momentum, and duration of a trend.
One of the primary uses of MACD is to observe crossovers between the MACD line and the signal line, which can signal potential buy or sell opportunities. Additionally, divergence between the MACD line and price movements can indicate possible trend reversals.
Traders often employ MACD to confirm trends, pinpoint entry or exit points, and evaluate the intensity of a market trend. By utilizing the insights provided by the MACD indicator, traders can make informed decisions based on the analysis of trend-following and momentum characteristics.
Relative Strength Index (RSI) Analysis
An essential tool in technical analysis, the Relative Strength Index (RSI) is a widely-used momentum oscillator that provides valuable insights into the speed and magnitude of price movements in the market.
- RSI values range from 0 to 100, with readings above 70 indicating overbought conditions and below 30 signaling oversold conditions.
- Traders often use RSI to identify potential trend reversals or confirm existing trends in the market.
- RSI can be applied to various timeframes, making it versatile for both short-term and long-term trading strategies.
- Divergences between RSI and price action can provide valuable insights into potential shifts in market direction.
- The RSI is a versatile tool that can help traders assess the strength of price movements and make informed decisions regarding entry and exit points based on overbought or oversold conditions.
Comparing Ichimoku Cloud and Keltner Channels
A comparative analysis of Ichimoku Cloud and Keltner Channels reveals distinct characteristics and functionalities catering to different aspects of technical analysis. Ichimoku Cloud, a comprehensive indicator, offers support and resistance levels, trend direction, and momentum signals in a single view, while Keltner Channels primarily focus on price volatility using the Average True Range.
Keltner Channels excel in identifying short-term price trends and possible reversals, whereas Ichimoku Cloud provides a broader perspective on market conditions and trend strength. Notably, Ichimoku Cloud includes a cloud area indicating future price movement potential through the intersection of Senkou Span A and Senkou Span B, unlike Keltner Channels which emphasize price range volatility.
Traders often combine both tools, utilizing Ichimoku Cloud for overall trend assessment and Keltner Channels for precise entry and exit points based on volatility, enhancing their analysis and decision-making process effectively in varying market conditions.
How Do Keltner Channels Compare to Other Technical Analysis Tools for Trading?
Keltner channels for analysis are a unique technical analysis tool that differs from others in its use of average true range to set the channel width. Compared to Bollinger Bands, Keltner channels may offer a smoother and more consistent view of price movements, making them a valuable addition to a trader’s toolkit.
Frequently Asked Questions
What Is Similar to the Keltner Channel?
Similar to the Keltner Channel, Donchian Channels and STARC Bands offer price channel indicators for trend analysis. They assist in identifying market shifts and trading opportunities by analyzing price movements and providing signals for buy and sell based on price action.
Which Is Better Keltner or Bollinger?
In comparing Keltner Channels and Bollinger Bands, the suitability depends on one's trading style and time horizon. Keltner Channels may provide more stable signals in trending markets, while Bollinger Bands excel in indicating short-term price movements.
Which Indicator Works Best With Keltner Channel?
The indicator that works best with Keltner Channels depends on the specific trading strategy and goals. Traders commonly combine MACD for trend confirmation, RSI for overbought/oversold signals, Stochastic Oscillator for momentum, ATR for volatility, and Ichimoku Cloud for comprehensive analysis.
What Indicator Is Better Than Bollinger Bands?
When comparing technical analysis tools, the Relative Strength Index (RSI) stands out as a popular choice for traders seeking momentum insights. Its ability to gauge overbought and oversold conditions complements Bollinger Bands by offering additional confirmation signals.
Conclusion
In conclusion, when comparing Keltner Channels to other technical analysis tools like Bollinger Bands, it is essential to consider their unique features and applications. Each tool offers valuable insights into market trends and potential reversals, catering to different trading strategies and risk tolerances.
Ultimately, choosing the most suitable tool depends on individual preferences and goals. As the saying goes, 'different strokes for different folks,' traders should carefully evaluate the strengths and weaknesses of each tool before making informed trading decisions.