
When it comes to mastering the Advance Decline Line, understanding its intricacies is key. By grasping how this indicator operates, you open doors to a deeper comprehension of market dynamics.
But what if you could go beyond just understanding and actually utilize this tool to its full potential? Stay tuned to discover practical strategies that can elevate your trading game and potentially unlock new avenues for success in the ever-evolving world of finance.
Understanding the Advance Decline Line Indicator
When analyzing the Advance Decline Line Indicator, focus on its ability to gauge market breadth by tracking the difference between advancing and declining stocks in an index. The AD Line provides valuable insights into market sentiment by showing the number of advancing stocks versus declining stocks.
A positive AD Line suggests a bullish trend, indicating that more stocks are advancing. Conversely, a negative AD Line signifies a bearish market sentiment, with more stocks declining. This indicator plays a crucial role in Technical Analysis as it can act as a leading indicator for potential market reversals and trend changes.
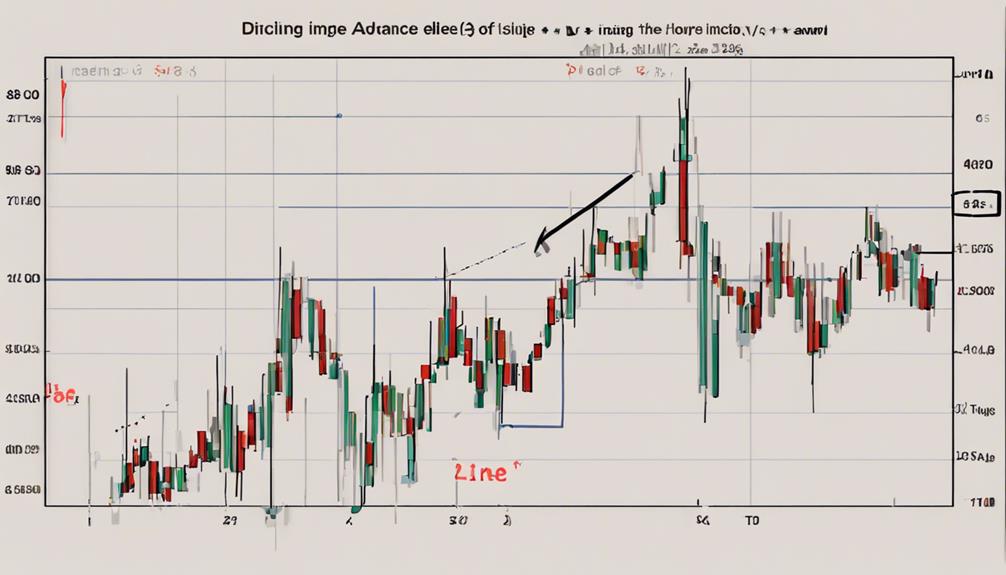
Analyzing Bullish Trends With AD Line
Analyzing bullish trends with the Advance Decline Line involves tracking the difference between advancing and declining stocks to gauge market sentiment and potential growth.
The AD Line indicates a bullish trend when there are more advancing stocks than declining stocks, reflecting positive market sentiment.
This indicator serves as a leading indicator for market growth, offering insights into potential market movements.
Case studies have shown the effectiveness of the AD Line in predicting bullish trends, making it a valuable tool for traders and investors.
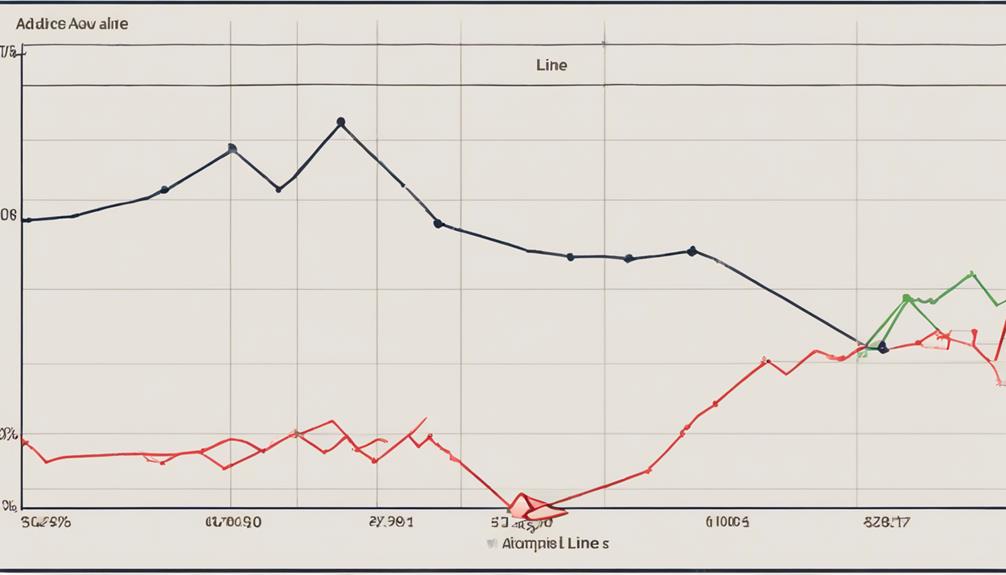
Bearish Divergence Warning Signs
As you delve into the concept of bearish divergence warning signs, recognize the historical significance of this phenomenon in signaling potential market trouble. Bearish divergence in the advance-decline line, observed when prices rise alongside weakening breadth, has historically foreshadowed market downturns like the dot-com bubble and the 2008 crisis. This divergence can hint at a looming market correction.
It's crucial to monitor volume trends as they can either confirm or refute these bearish signals in the advance-decline line. Strategies to navigate bearish divergence include reducing equity exposure and implementing stop-loss orders. By actively monitoring these early warning signs, you can position yourself better to anticipate potential downturns and adjust your investment approach accordingly.
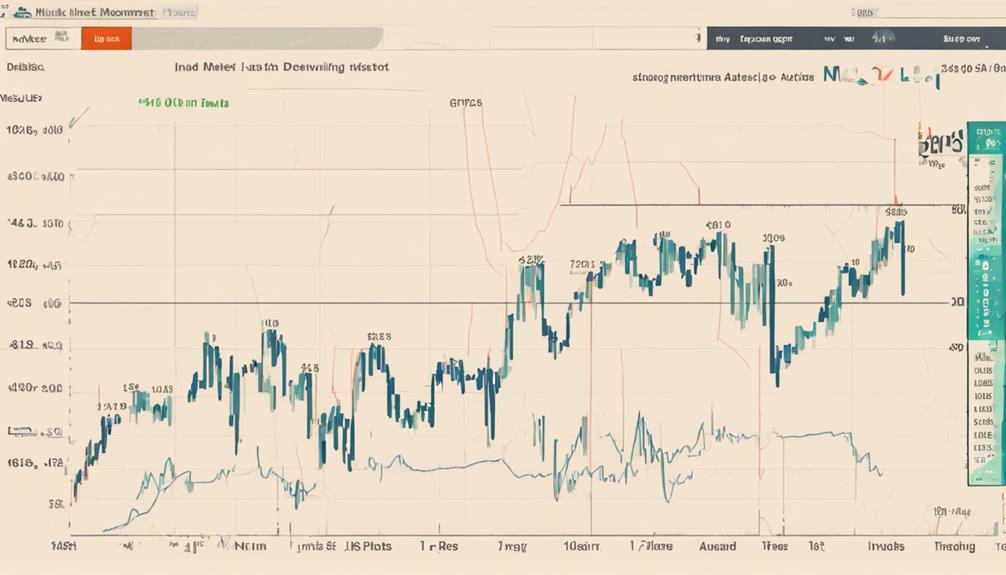
Measuring Market Strength With AD Line
To gauge market strength accurately, utilize the Advance Decline Line (AD Line) as it tracks the disparity between advancing and declining stocks. Here's how to measure market strength effectively with the AD Line:
- Leading Indicator: The AD Line can serve as a leading indicator for index performance, offering insights into potential market trends.
- Market Breadth: Tracking the AD Line over time provides a comprehensive view of market breadth, indicating the overall health of the market.
- Trading Strategies: Understanding AD Line movements can enhance decision-making and refine trading strategies for investors.
- Interpretation: A positive AD Line signifies more advancing stocks, reflecting market optimism and suggesting potential growth opportunities.
Can You Provide Tips for Mastering the Advance Decline Line?
Mastering the advance decline line can be achieved by learning the method to read advance decline line accurately. Keep a close eye on market trends, monitor changes, and utilize technical analysis tools to interpret the advance decline line data effectively. Stay updated with market movements to make informed decisions.
What Are the Key Steps in Mastering the Advance Decline Line?
Mastering the advance decline line insights involves understanding the key steps to effectively analyze market trends. By learning to interpret the ratio of advancing to declining stocks, identifying divergences, and utilizing key moving averages, traders can gain valuable insights into market strength and potential reversals.
Interpreting Index Movements Using AD Line
Interpreting index movements using the AD Line provides valuable insights into market breadth and overall market health. By tracking advancing and declining stocks within an Index, the AD Line serves as a powerful tool for analyzing market sentiment and direction.
Positive AD Line values indicate a higher number of advancing stocks, suggesting market strength, while negative values may signal weakness. Monitoring AD Line movements is crucial for detecting trends and potential reversals in the market.
When combined with other technical indicators, such as moving averages or volume analysis, the AD Line can enhance market analysis by offering a comprehensive view of market dynamics. Understanding the dynamics of the AD Line is essential for making informed decisions regarding market trends and potential reversals.
Frequently Asked Questions
How Do You Use Advance Decline Line?
To use the advance decline line effectively, analyze the difference between advancing and declining stocks in an index. Track trends, reversals, and market breadth. Calculate cumulative differences to gauge market strength and weakness. Combine with other indicators for informed decisions.
What Is the Mechanism to Calculate Advance Decline Line?
To calculate the Advance Decline Line, subtract declining stocks from advancing stocks daily. This calculation forms the basis for tracking market breadth. Understanding this mechanism is vital for analyzing market trends and potential reversals.
What Is the Advance Decline Strategy?
To master the Advance Decline Line strategy, track the difference between advancing and declining stocks in an index. Identify trends and potential reversals by measuring market breadth through stock price movements, indicating bullish or bearish sentiment for informed trading decisions.
What Is the Formula for Advance Decline Volume?
To find Advance Decline Volume (ADV), subtract declining volume from advancing volume. It gauges buying or selling pressure strength, offering insights into market sentiment and potential price shifts. Monitoring ADV helps traders spot trends and confirm reversals.
Conclusion
As you master the Advance Decline Line, you unlock the keys to market trends and potential reversals. Like a skilled navigator with a trusty compass, the AD Line guides you through the turbulent waters of trading, helping you stay on course and avoid pitfalls.
With its insights into market sentiment and strength, this indicator becomes your steadfast companion in the ever-changing landscape of the financial markets. Embrace the power of the AD Line and watch your trading prowess soar.