
Exploring the intricacies of grasping trends through the ADX indicator unveils a sophisticated approach to evaluating market dynamics.
As traders navigate the complexities of trend identification and momentum analysis, the ADX indicator emerges as a beacon of clarity amidst the ebbs and flows of price movements.
Its unique ability to quantify trend strength offers a profound insight into market behavior, but the true power lies in how traders leverage this information to make informed decisions.
Stay tuned to uncover the nuanced strategies and tactical maneuvers that can elevate your trading acumen in the ever-evolving landscape of financial markets.
Understanding ADX Indicator Basics
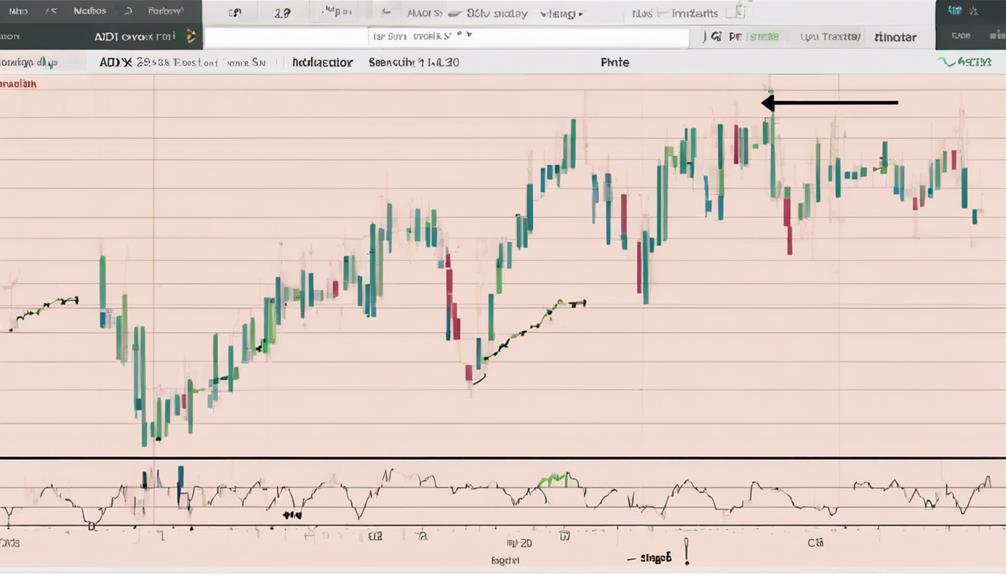
In the realm of technical analysis, a foundational concept that plays a crucial role in assessing market trends and their strength is the ADX indicator. The Average Directional Index (ADX) quantifies trend strength by analyzing price range expansion over a specified period, typically 14 bars. ADX values range from 0 to 100 and are non-directional, focusing solely on the magnitude of price movement.
Alongside ADX, the Positive Directional Movement Indicator (+DMI) and Negative Directional Movement Indicator (-DMI) lines are used to determine trend direction and momentum. An ADX reading above 25 suggests a strong trend, making it suitable for trend-trading strategies. Conversely, low ADX values may indicate weak or absent trends in the market.
Peaks in the ADX line signify potential shifts in trend momentum, providing valuable insights for traders looking to capitalize on evolving market conditions. Understanding these basic principles of the ADX indicator is essential for traders seeking to navigate and interpret market trends effectively.
Interpreting ADX Trend Strength
Building on our understanding of the ADX indicator's basics, assessing trend strength through the ADX values provides vital insights for traders navigating market dynamics.
The ADX Indicator offers a numerical value that represents the strength of a trend. Traders rely on this value to measure the direction and strength of a trend. ADX values above 25 typically indicate a strong trend, making it suitable for trend-trading strategies.
Conversely, low ADX values between 0-25 suggest weak or absent trends in the market, signaling a potential range-bound trading environment. Additionally, a rising ADX value signifies increasing trend strength, while a falling ADX may indicate potential trend changes or weakening momentum.
By monitoring the ADX line and its average, traders can gain valuable information on the intensity of trends, helping them make informed decisions regarding market positions and risk management strategies.
Understanding and interpreting ADX trend strength is crucial for traders looking to capitalize on market movements effectively.
Utilizing ADX for Trend Identification
Utilizing the ADX indicator for trend identification provides traders with a quantitative tool to assess and capitalize on market trends effectively.
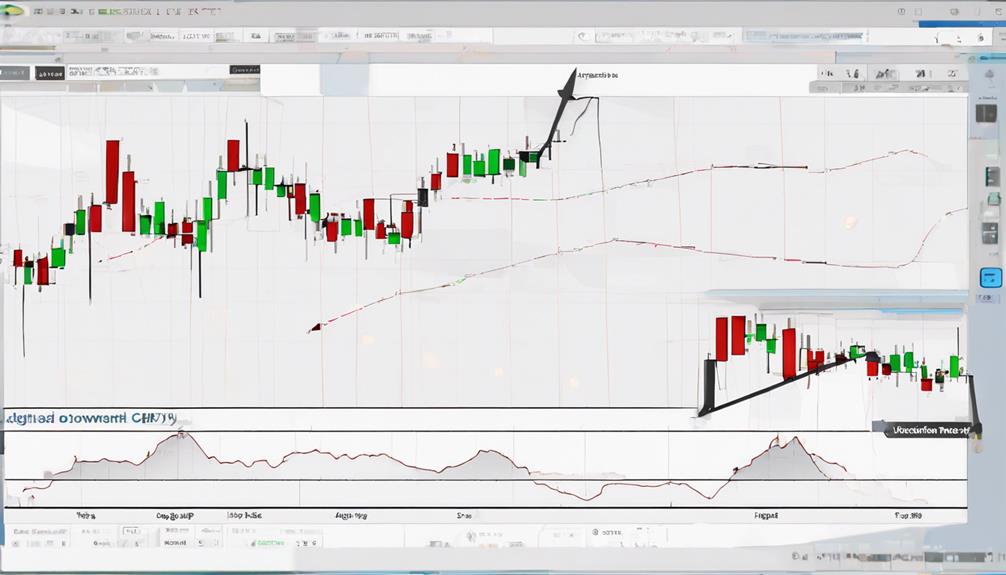
The Average Directional Index (ADX) measures the strength of a trend without regard to its direction. It is derived from the two Directional Movement Indicator (DMI) lines, namely the positive DI (+DI) and the negative DI (-DI).
When the ADX line is moving higher, it indicates that the strength of the trend is increasing. ADX values above 25 suggest a strengthening trend suitable for trend-trading strategies, while values below 25 may indicate weak or range-bound conditions.
Peaks in the ADX line can visually represent trend momentum, showing the increasing or decreasing strength of price moves.
Strategies for ADX Indicator Implementation
Having established the significance of ADX values above 25 in identifying strong trend conditions suitable for trend-trading strategies, it is essential to delve into specific strategies for implementing the ADX indicator effectively in trading scenarios.
The ADX measures the strength of a trend rather than its direction, making it a valuable tool for traders. By combining ADX with other technical indicators like the Directional Movement Index (DMI), traders can determine whether a trend is gaining or losing strength.
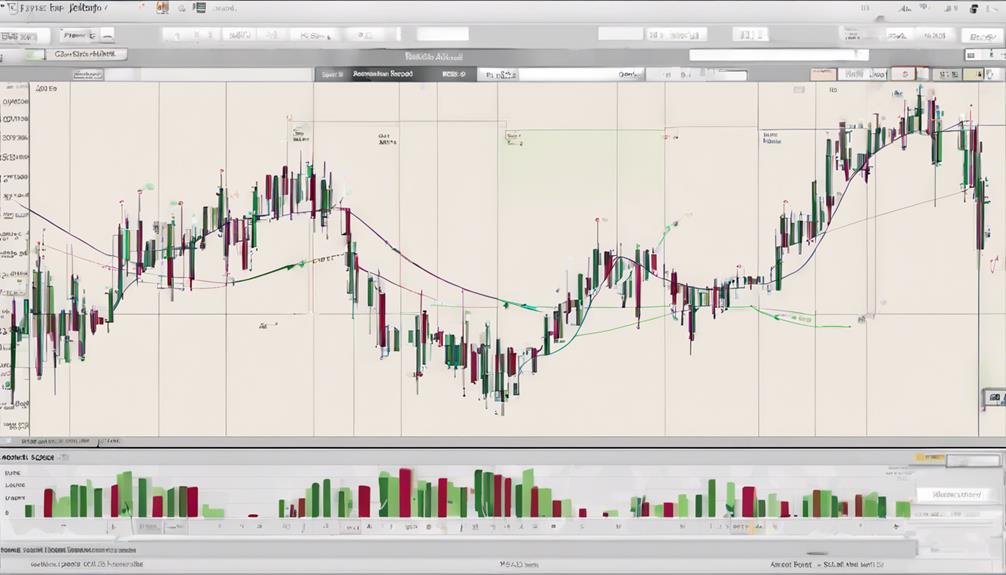
One strategy involves using ADX values between 25-100 to gauge the trends' strength levels, aiding in making well-informed trading decisions. Additionally, monitoring the ADX line's direction provides insights into changes in trend strength over time.
Traders can also use ADX to identify accumulation or distribution phases before a trend emerges, especially when ADX readings are low. Incorporating ADX with moving averages or oscillators can further enhance trading strategies by providing a comprehensive view of market trends.
Enhancing Trading Decisions With ADX
Enhancing trading decisions with the ADX indicator involves leveraging its ability to measure trend strength and identify potential shifts in market momentum.
- The ADX values above 25 indicate strong trending conditions, making it suitable for trend-trading strategies.
- Combining ADX with price analysis enhances the accuracy of identifying trend strength and direction.
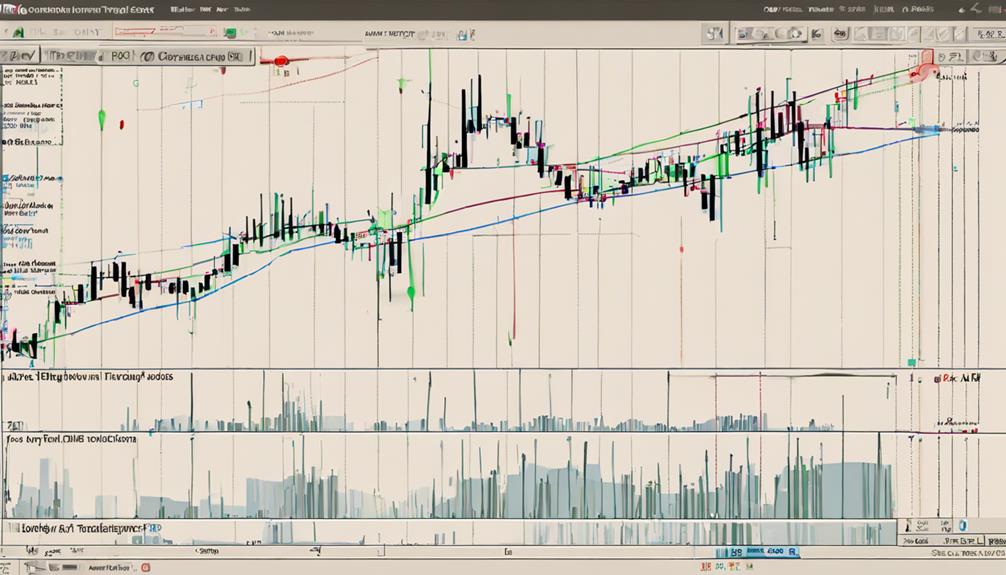
- ADX peaks signify momentum shifts in a trend, with higher peaks indicating stronger momentum.
- Employing ADX can help confirm breakouts and identify potential trend continuation post-breakout.
Understanding ADX as a range finder is crucial in recognizing the transition between trending and ranging market conditions. By incorporating these aspects into trading decisions, traders can make more informed choices based on the prevailing market conditions.
Utilizing the ADX indicator effectively not only assists in understanding the current market trend but also aids in predicting potential future price movements, thereby enhancing overall trading performance.
Can the ADX indicator be used in conjunction with the Zig Zag indicator to analyze market trends effectively?
Yes, traders can utilize Zig Zag indicator in conjunction with the ADX indicator to analyze market trends effectively. The Zig Zag can help filter out market noise and identify significant price movements, while ADX can gauge the strength of a trend. Combining both indicators can provide a comprehensive trend analysis.
How Do ADX and Trix Indicators Differ in Grasping Market Trends?
The ADX indicator focuses on measuring trend strength, while the Trix indicator identifies trend reversals. ADX helps in determining whether a stock is trending or not, while the Trix indicator is used to identify potential buy or sell signals based on the rate of change in a stock’s price. Both are useful in grasping Trix indicator fluctuations.
Frequently Asked Questions
How to Use ADX for Trend?
To utilize ADX for trend analysis, monitor values above 25 for strong trends suitable for trend-trading strategies. ADX peaks visually represent trend momentum, aiding in identifying increasing or decreasing momentum. Contextual understanding of price movements enhances ADX interpretation.
What Is the Best Combination With ADX Indicator?
Pairing the ADX indicator with complementary tools like directional indicators, moving averages, support and resistance levels, volume analysis, and candlestick patterns enhances trend analysis accuracy, providing a holistic view of trend strength and potential reversals.
Does the ADX Indicator Show if the Trend Is Gaining or Losing Strength?
The ADX indicator gauges trend strength. Rising ADX values signal a trend gaining momentum, while falling values indicate potential reversals or loss of strength. Understanding these dynamics empowers traders to make strategic decisions on market entries and exits.
What Is the Best Time Frame to Use ADX Indicator?
For optimal ADX indicator usage, consider the trading style and objectives. Day traders may favor 5 or 15-minute charts, while swing traders might opt for 1 or 4-hour time frames. Long-term investors typically find weekly or monthly charts more suitable.
Conclusion
In conclusion, the ADX indicator serves as a valuable tool for traders in analyzing trend strength and making informed trading decisions.
By understanding its basics, interpreting trend strength, utilizing it for trend identification, and implementing strategies effectively, traders can enhance their trading performance.
For example, a hypothetical scenario could involve a trader successfully identifying a strong uptrend in a stock using ADX, resulting in profitable trades and improved portfolio growth.