
When it comes to navigating the intricate landscape of trading, the MACD indicator stands out as a beacon of insight amidst the market's complexities.
Unveiling the nuances of this powerful tool can illuminate your trading journey and potentially redefine your approach to market analysis.
Understanding its intricacies and mastering its application could be the key to unlocking a realm of strategic possibilities that may enhance your trading outcomes significantly.
Understanding MACD Indicator Basics
To grasp the fundamentals of the MACD Indicator, start by understanding its components and how they interact to signal potential market movements.
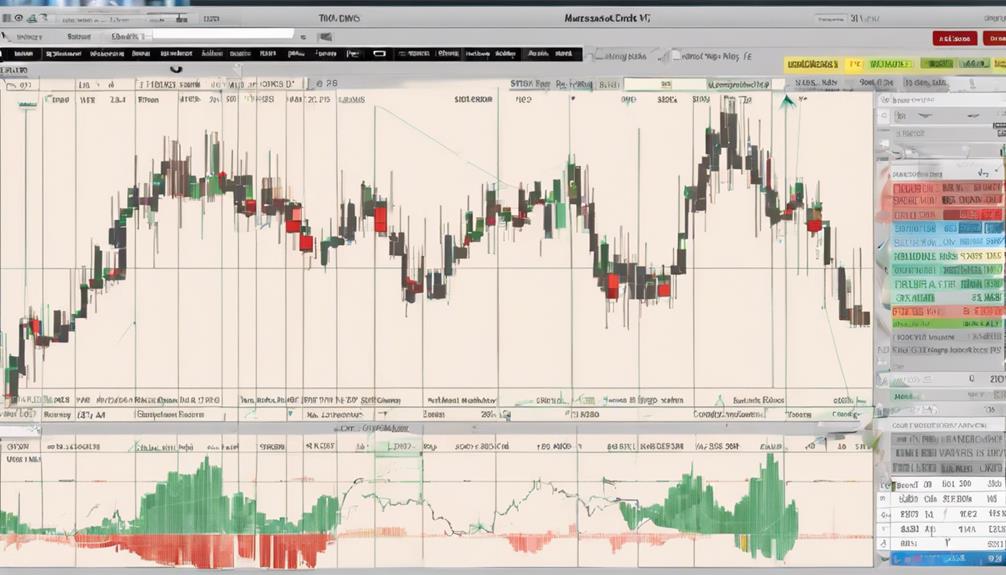
The MACD Indicator consists of the MACD line, signal line, and histogram, providing traders with valuable insights into trend direction and potential buy/sell signals.
The MACD line is calculated by subtracting the 26-period Exponential Moving Average (EMA) from the 12-period EMA, showing the relationship between these two moving averages.
Traders typically watch for crossovers between the MACD line and the signal line as these crossovers can indicate entry and exit points in the market.
Familiarizing yourself with these basic concepts of the MACD Indicator is crucial for effectively incorporating it into your trading strategies and decision-making processes.
Importance of MACD Line Interpretation
Understanding the significance of interpreting the MACD line is crucial for traders seeking to make informed decisions based on trend direction and market momentum. When looking at the MACD line, keep in mind:
- Positive MACD values indicate bullish momentum, suggesting potential buy signals.
- Negative MACD values signify bearish momentum, hinting at possible sell signals.
- Traders utilize the MACD line to spot trend changes and evaluate the strength of market movements.
- Crossovers between the MACD line and the signal line are pivotal as they generate buy or sell signals, providing insights into market dynamics.
Utilizing MACD Crossovers Effectively
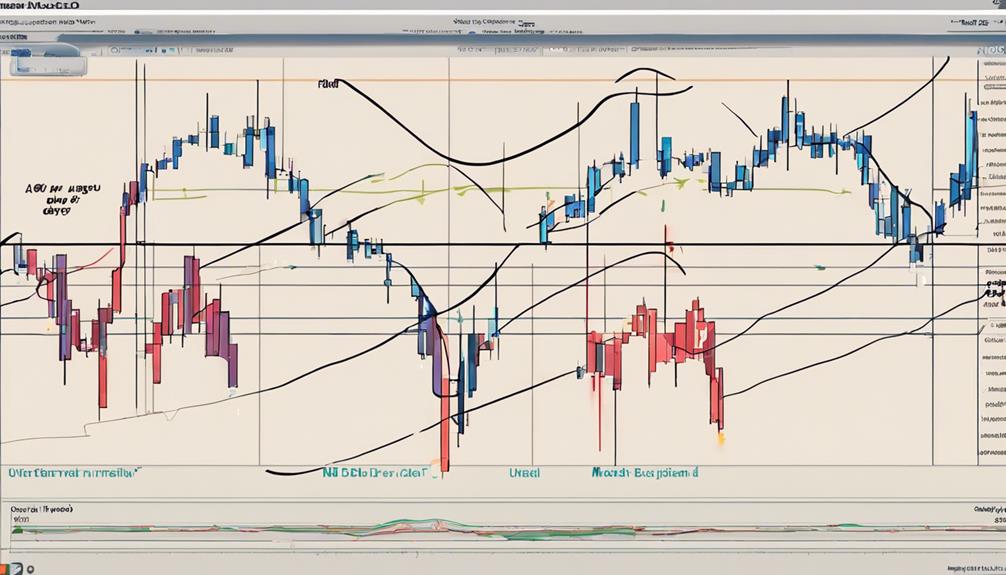
When utilizing MACD crossovers effectively in trading, focus on the relationship between the MACD line and the signal line. Traders often look for bullish crossovers, where the MACD line moves above the signal line, signaling potential buy opportunities.
Conversely, bearish crossovers, with the MACD line dropping below the signal line, indicate potential sell signals. It's crucial to remember that MACD crossovers are lagging indicators, confirming trend changes after they've occurred.
Significance of MACD Histogram Analysis
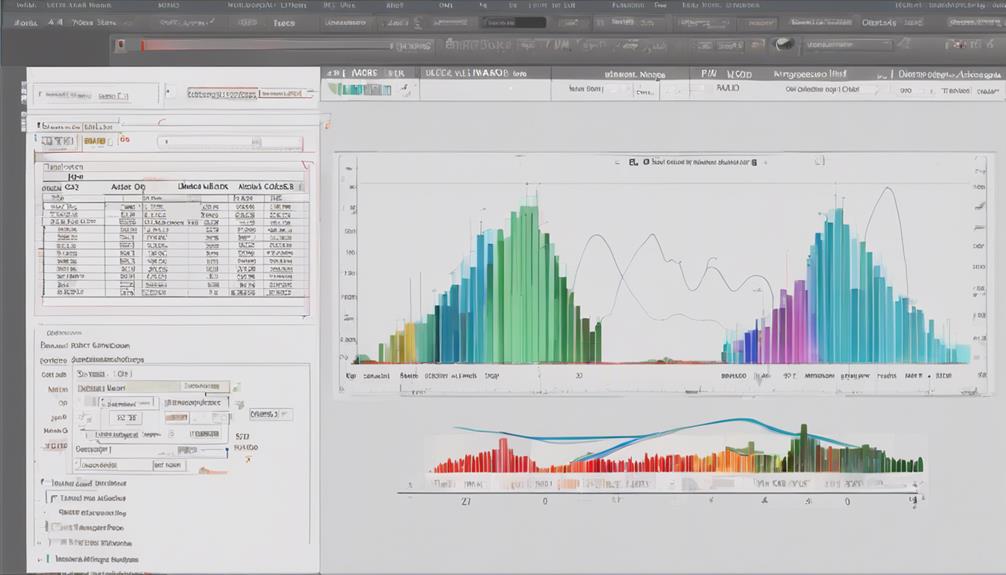
When analyzing the MACD histogram, you can gain valuable insights into market trends by observing the relationship between the histogram bars and the zero line.
Bars above zero signal bullish momentum, while bars below suggest bearish strength.
Histogram Interpretation Tips
Analyzing the MACD histogram provides traders with crucial insights into market momentum and potential trend reversals. When interpreting the histogram, keep these tips in mind:
- Positive histogram bars signal bullish momentum, while negative bars indicate bearish momentum.
- The height of the histogram reflects the strength of price momentum in the market.
- Look for histogram peaks and troughs to confirm trend direction and potential reversals.
- Analyzing the histogram can reveal the acceleration or deceleration of price movements.
Identifying Bullish/Bearish Signals
To effectively assess market trends and potential entry points, understanding the significance of MACD histogram analysis is paramount. The MACD histogram visually represents the difference between the MACD line and the signal line. Rising histogram bars indicate increasing bullish momentum, while falling bars suggest growing bearish pressure.
Traders utilize these bars to confirm trend strength and identify potential entry or exit points. By analyzing the height and direction of the histogram bars, traders can gain insights into market sentiment and price movement dynamics. Recognizing MACD histogram patterns enhances the ability to pinpoint bullish or bearish signals, aiding in strategic decision-making for effective trading strategies.
Incorporating MACD Divergence Strategy
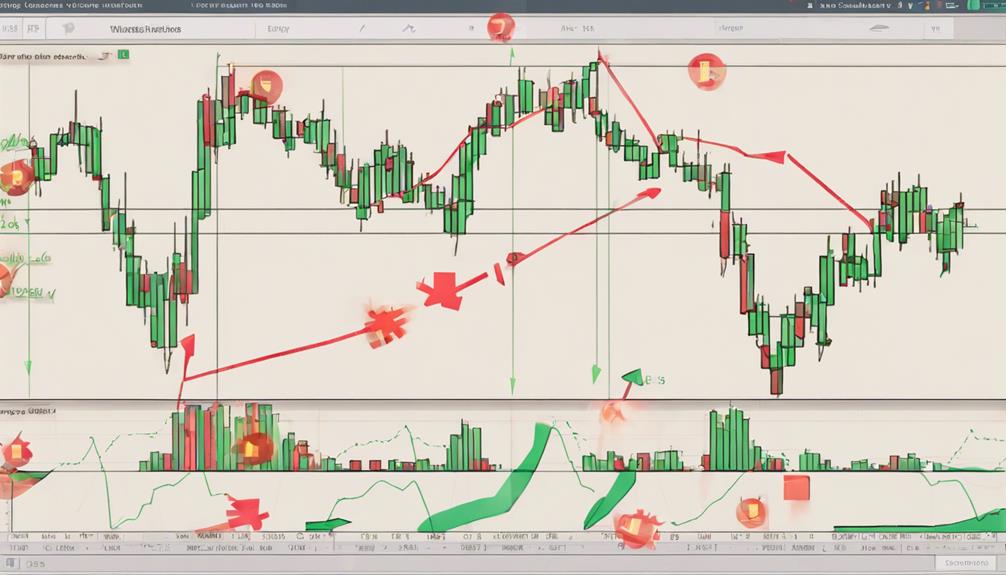
By identifying discrepancies between price movements and MACD indicator signals, you can effectively incorporate the MACD Divergence Strategy to anticipate potential trend reversals. When utilizing this strategy, keep in mind:
- Look for bullish divergence, where price makes lower lows and MACD makes higher lows.
- Watch for bearish divergence, characterized by price forming higher highs while MACD displays lower highs.
- Recognize that divergence signals in MACD can offer early indications of shifts in market direction.
- Anticipate potential trend reversals by aligning your trading decisions with the insights gained from MACD signals.
Maximizing Profits With MACD Volume
To optimize your trading strategies with MACD Volume, understanding how volume interacts with price movements is essential for maximizing profits effectively.
MACD Volume is a valuable tool that combines trading volume with MACD analysis to assess the strength of price trends. By incorporating trading volume, you can confirm or contradict MACD signals, aiding in decision-making. This integration enhances the accuracy of trading signals, leading to improved profitability.
Recognizing the correlation between volume and price movements is crucial when implementing MACD Volume strategies. By paying attention to volume signals in conjunction with MACD indicators, you can refine your trading approach and capitalize on opportunities in the market successfully.
Avoiding Common MACD Mistakes
Avoiding common MACD mistakes requires a deep understanding of the indicator's nuances and potential pitfalls. To navigate these challenges effectively, consider the following:
- Beware of false positive crossovers: Misinterpreting these can lead to trading errors and losses.
- Avoid overreliance: Using MACD without considering market conditions can result in poor decision-making.
- Know the limitations: Understanding these helps avoid false signals and make more informed trades.
- Utilize other indicators: Combining MACD with other tools provides confirmation and reduces the risk of inaccurate signals.
For a well-rounded approach to technical analysis, incorporate MACD into comprehensive trading strategies that consider various indicators for a more robust trading plan.
What Are the Best Tips for Using the MACD Indicator for Successful Trading?
When using the MACD indicator for trading, implementing the top 5 MACD indicator tips can enhance your success. These tips include understanding the divergences, using the signal line for confirmation, applying it to different timeframes, combining it with other indicators, and adjusting the settings for specific assets.
Frequently Asked Questions
What Is the Importance of Macd?
MACD is crucial for traders, helping to identify trend direction and potential buy/sell signals. It confirms trends, assesses momentum strength, and guides entry/exit points. Understanding MACD enhances trading strategies and decision-making processes significantly.
What Are the 3 Components of MACD Indicator?
You need to understand the MACD indicator's three components: MACD line, signal line, and histogram. The MACD line, derived from EMAs, contrasts with the signal line, an EMA, to show trends and potential trading signals.
What Is the Most Profitable MACD Strategy?
To maximize profits with the MACD indicator, combine crossovers with other indicators for confirmation. Stay disciplined in your approach, backtest strategies for effectiveness, and adapt to market conditions. Consistency in trading leads to success.
What Are the Ultimate MACD Settings?
To optimize your MACD, stick to default settings of 12, 26, and 9 for fast EMA, slow EMA, and signal line. Experiment with different configurations based on your trading style and market conditions for better results.
Conclusion
In conclusion, mastering the MACD indicator can be the key to unlocking profitable trading opportunities. By understanding its basics, interpreting its signals, and utilizing its crossovers and divergence strategies effectively, you can enhance your trading arsenal.
Remember, the devil is in the details when it comes to analyzing market trends and making informed decisions. So, don't underestimate the power of the MACD indicator in your trading toolkit. Keep honing your skills and stay ahead of the game!