
Are you looking to enhance your trading skills with the MACD indicator but unsure where to start? Understanding the top 5 MACD indicator tips can significantly impact your trading success.
From mastering the basics to utilizing advanced strategies, each tip plays a crucial role in maximizing your trading potential. Stay tuned to uncover these essential tips and take your trading game to the next level.
MACD Indicator Overview
The MACD Indicator, developed by Gerald Appel, utilizes two exponential moving averages and a histogram to provide insights into trend direction and momentum. This trading tool measures the convergence or divergence of these moving averages, ultimately reflecting the strength of a trend.
The MACD line represents the difference between the 26-day and 12-day exponential moving averages, while the signal line, typically a 9-day EMA of the MACD line, helps identify potential entry and exit points. The histogram, displayed as bars, illustrates the gap between the MACD line and the signal line.
Importance of MACD Crossovers
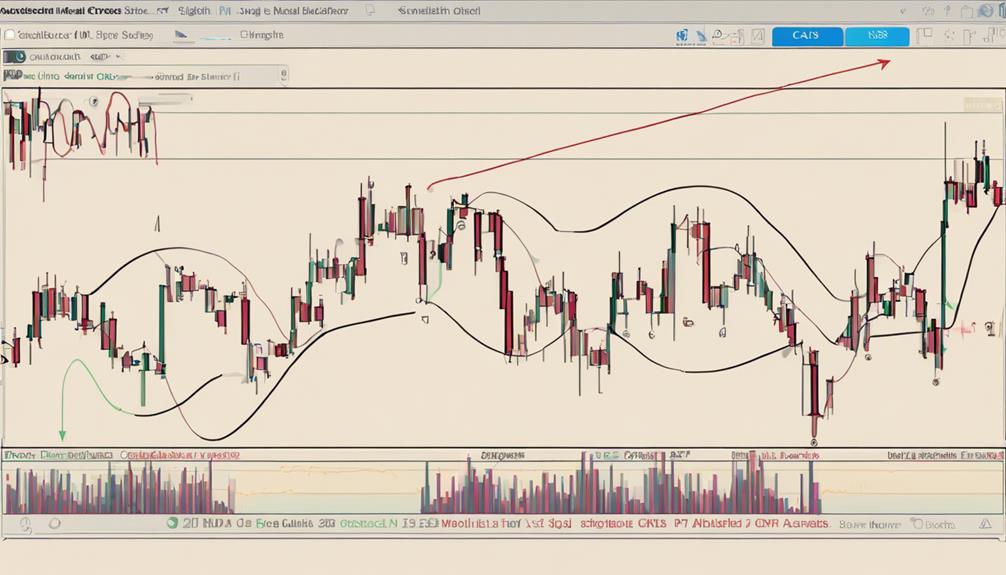
When considering trading strategies involving the MACD Indicator, understanding the importance of MACD crossovers is crucial for identifying potential trend shifts and making informed market decisions.
Bullish crossovers, where the MACD line crosses above the signal line, signal a possible uptrend, making them potential buy signals and entry points. Conversely, bearish crossovers, occurring when the MACD line crosses below the signal line, suggest a potential downtrend, indicating sell signals and potential exit points.
Traders often rely on MACD crossovers due to their simplicity and effectiveness in trend identification. By paying close attention to these crossovers, you can enhance your ability to capitalize on market movements and improve your overall trading success.
Utilizing MACD Histogram Effectively
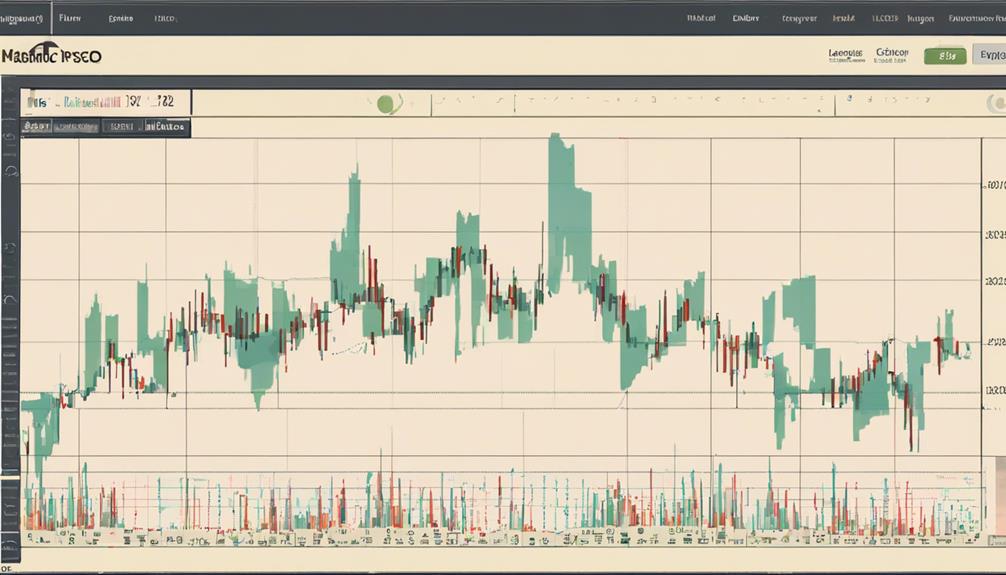
To effectively utilize the MACD Histogram in your trading strategy, focus on interpreting the bars above or below the zero line to gauge trend strength. Bars above the zero line indicate bullish momentum, signaling a strengthening trend. Conversely, bars below the zero line suggest bearish momentum and a weakening trend.
Monitoring histogram reversals can help you identify potential trend changes and confirm existing trends. By comparing the MACD Histogram to the MACD line and signal line, you can better understand momentum shifts in the market.
This information equips you to make more informed trading decisions based on the strength or weakness of the trend as reflected in the histogram's movements.
Understanding MACD Divergence Signals
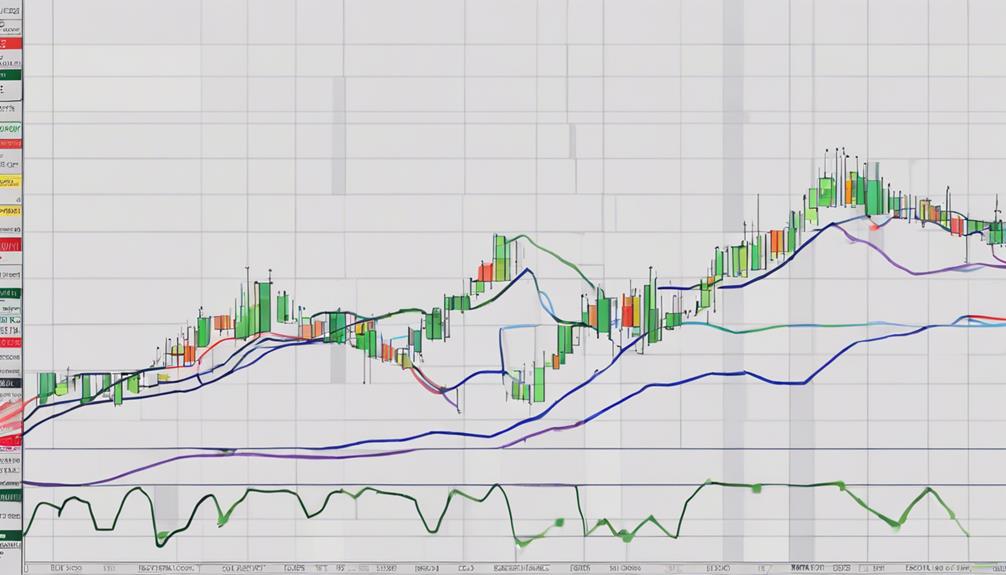
In understanding MACD Divergence Signals, you can pinpoint potential trend reversals by observing the price trend and MACD indicator moving in opposite directions.
Bullish divergence occurs when the price makes lower lows while the MACD makes higher lows, signaling a possible upward reversal.
On the other hand, bearish divergence happens when the price makes higher highs while the MACD makes lower highs, indicating a potential downward reversal.
These divergence signals are essential for identifying shifts in price direction, whether for trend reversals or continuations in the market.
Timing Entries With MACD Zero Crosses
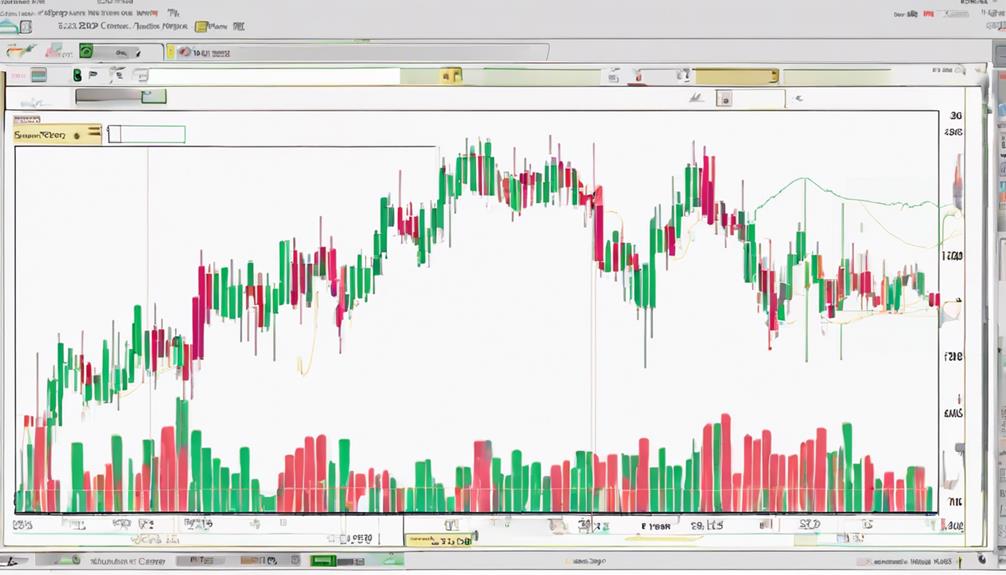
By recognizing and capitalizing on MACD zero crosses, you can effectively time your entries in the market, leveraging these signals for optimal strategy execution.
When it comes to timing entries with MACD zero crosses, consider the following:
- MACD zero crosses indicate potential trend reversals, offering opportunities to enter new trend formations with lower false reversal signals.
- Zero crosses provide more reliable trend confirmation than crossovers, aiding in determining entry and exit points in trending markets.
- Monitoring zero crosses helps you align with the overall trend direction, leading to successful trading decisions. Utilize these signals to enhance your trading strategies and make informed moves in the market.
How Can I Use MACD Indicator Tips for Successful Trading?
When it comes to mastering MACD indicator strategies for successful trading, it’s essential to understand how to interpret the signals provided. Pay close attention to the MACD line and signal line crossovers, as well as divergence patterns. Utilizing these tips can help improve your trading success.
Frequently Asked Questions
What Is the Most Profitable MACD Strategy?
To find the most profitable MACD strategy, focus on your risk tolerance and trading style. Experiment with crossovers, histogram reversals, and zero line crosses. Backtest various approaches and consider combining MACD with indicators like RSI for enhanced profitability. Adapt to market conditions for success.
What Is the Best Way to Trade With Macd?
To trade with MACD effectively, combine it with other indicators for signal confirmation. Enhance decision-making by pairing MACD with RSI or Bollinger Bands. Identify market conditions like overbought or oversold using MACD. Analyze trends swiftly and assess momentum for a robust trading strategy.
What Is the Best Indicator With Macd?
To enhance your MACD trading, look to the Signal Line. This 9-day EMA of the MACD line can offer valuable insights. Combining it with RSI or SMA can further refine your strategy for successful trading.
How Can I Make My MACD More Accurate?
To make your MACD more accurate, adjust settings to fit your style, use longer time frames for clearer signals, and pair with indicators like RSI or Bollinger Bands. Backtest various configurations for optimization and practice risk management for success.
Conclusion
In conclusion, mastering the Top 5 MACD Indicator Tips for Successful Trading is essential for maximizing your trading strategies.
By understanding MACD components, utilizing different trading strategies, adjusting settings, and combining with other indicators, you can enhance your trading outcomes.
Remember, continuous learning and adaptability are key to success in the ever-changing market. So, stay informed, stay flexible, and keep honing your skills to achieve your trading goals.
After all, knowledge is power in the world of trading.