
Picture yourself navigating a stormy sea, relying on the stars to guide your ship safely to shore. Just as ancient mariners used celestial bodies to find their way, traders in bearish markets depend on momentum indicators to steer through turbulent market conditions.
However, not all indicators are created equal. Discover the five best momentum indicators tailored for bearish markets, each offering unique insights and strategic advantages to help you navigate the choppy waters of declining prices and bearish sentiment.
Relative Strength Index (RSI)
When evaluating bearish markets, you must consider the Relative Strength Index (RSI) as a crucial indicator for measuring the speed and change of price movements. RSI helps traders identify overbought or oversold conditions during downtrends. In a bearish market, RSI values above 70 may indicate overbought levels and potential price reversals.
Traders utilize RSI to confirm the strength of a bearish trend and anticipate possible trend changes. By providing clear signals, RSI enables traders to manage risk and make informed decisions in bearish market conditions.
Understanding how RSI reflects momentum in trading can aid in navigating the complexities of bearish markets, allowing for more strategic decision-making based on price movements and trend analysis.
Average Directional Index (ADX)
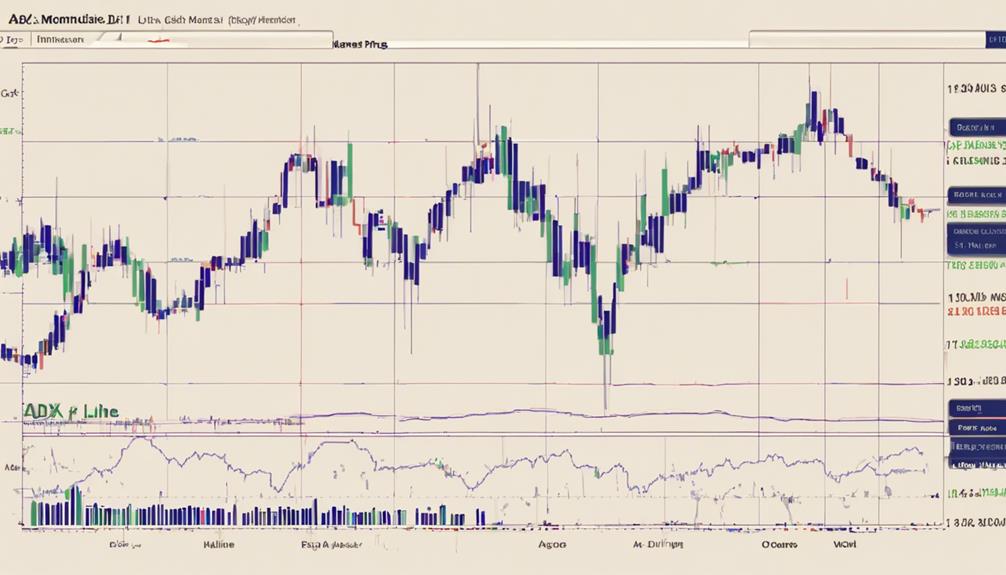
The Average Directional Index (ADX) quantifies the strength of a bearish trend in the market, providing traders with crucial insights into trend robustness. ADX ranges from 0 to 100, with values above 25 indicating a strong trend. It doesn't reveal the trend's direction but focuses solely on its strength.
Traders rely on ADX to confirm bearish market conditions and filter out false signals. High ADX readings suggest a robust downtrend, making it a valuable tool for analyzing bearish markets. By using ADX in conjunction with other indicators, traders can gain a comprehensive understanding of the market dynamics and make informed decisions during bearish trends.
Commodity Channel Index (CCI)
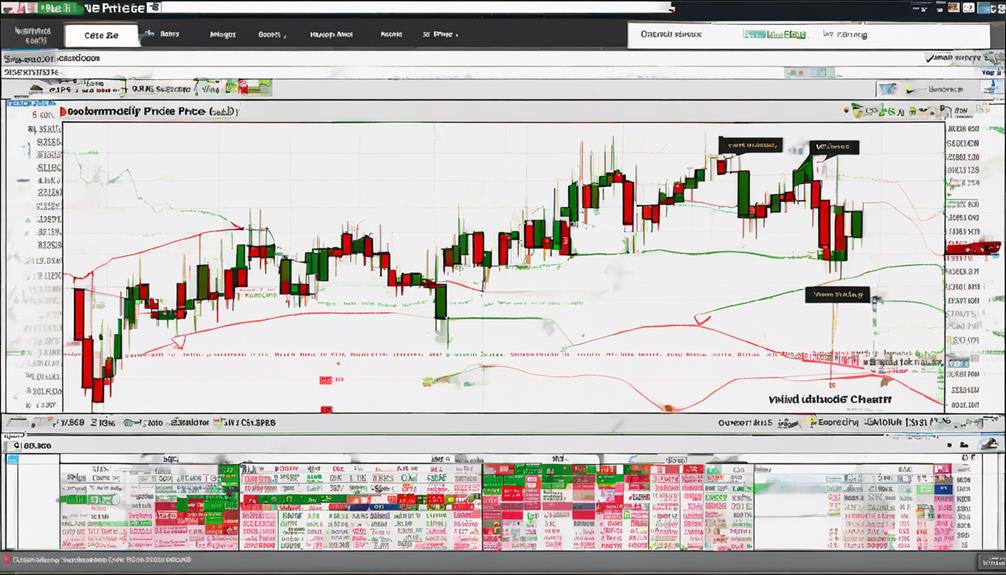
Developed by Donald Lambert in 1980, the Commodity Channel Index (CCI) identifies cyclical trends across commodities, stocks, and forex markets. CCI measures deviations from a security's mean, signaling overbought conditions above +100 and oversold conditions below -100. Traders utilize CCI to pinpoint potential trend reversals, with extreme CCI readings suggesting unsustainable price levels.
As a leading indicator, CCI provides early signals of impending market direction changes before price movements manifest. In bearish markets, combining CCI with other technical analysis tools can enhance its efficacy in identifying momentum shifts. By interpreting CCI in the context of cyclical trends, traders can make informed decisions when navigating volatile market conditions.
Moving Average Convergence Divergence (MACD)
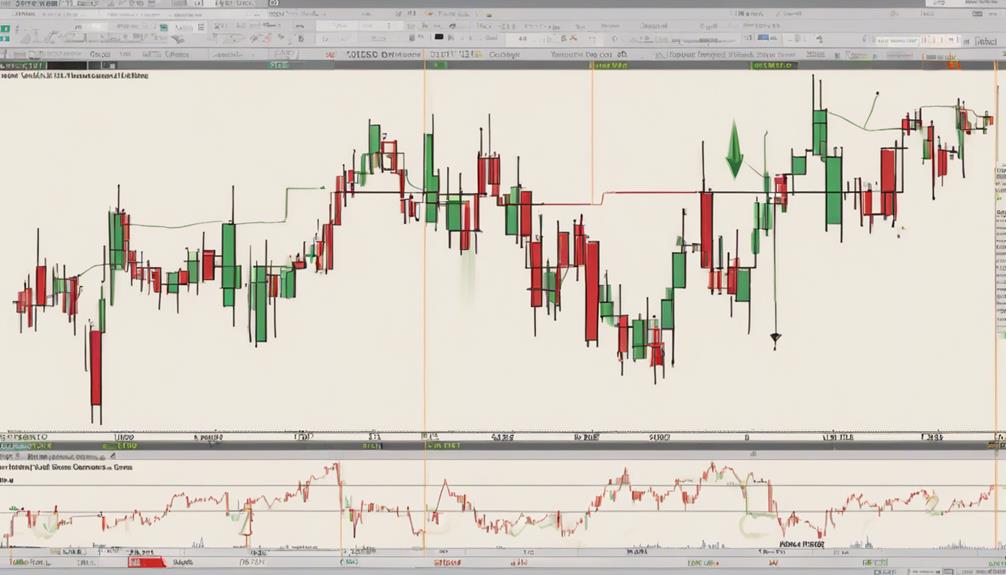
Utilize Moving Average Convergence Divergence (MACD) as a powerful trend-following indicator to gauge price movement strength in bearish markets. MACD, a popular choice among traders, uses two moving averages to analyze price movements. Its crossover signals are valuable for identifying potential trend reversals in bearish market conditions.
Divergences in MACD can offer insights into shifts in market sentiment, aiding traders in confirming bearish trends. By combining MACD with other indicators, such as the Relative Strength Index (RSI), traders can make informed decisions within the context of bearish markets.
The ability of MACD to capture momentum shifts and trend reversals makes it an essential tool for navigating bearish market conditions effectively.
Momentum
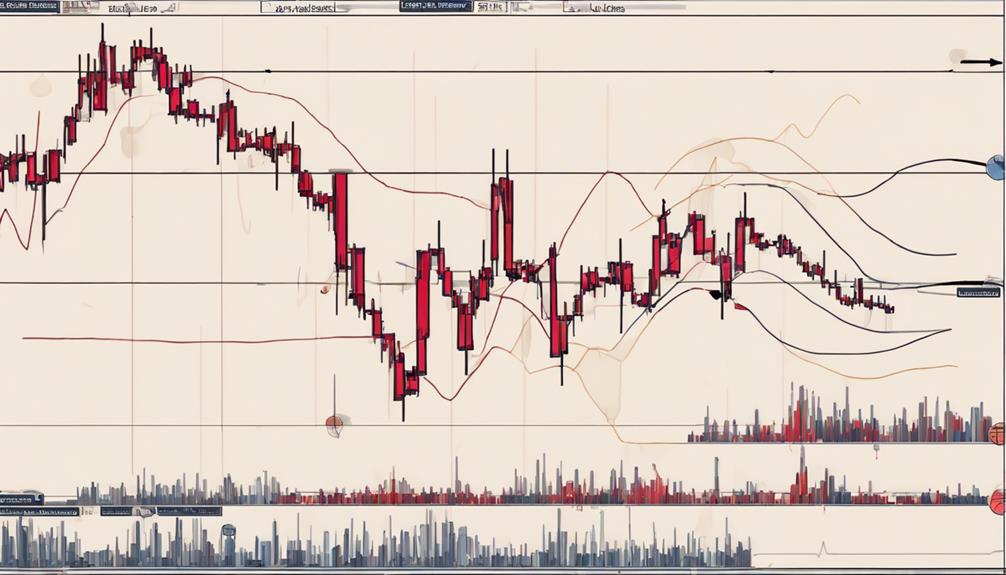
Assessing price momentum in bearish markets is crucial for gauging the speed and strength of price movements. Utilizing momentum indicators such as RSI, MACD, and Stochastic Oscillator can provide valuable insights into potential trend reversals and confirm the prevailing downtrend.
These indicators help in identifying overbought conditions, indicating trend weakness, and highlighting potential entry/exit points. By paying attention to these signals, traders can effectively manage risk and capitalize on downward price movements.
Understanding the dynamics of momentum in bearish markets is essential for making informed trading decisions and maximizing profits in challenging market conditions.
What Are Some Effective Momentum Indicators for Bearish Markets in Forex Trading?
When trading in bearish markets in forex trading, it’s crucial to use effective momentum indicators in forex trading to make informed decisions. Some powerful momentum indicators in forex trading include the Moving Average Convergence Divergence (MACD), Relative Strength Index (RSI), and Stochastic Oscillator. These indicators can help traders identify potential reversals and momentum shifts in the market.
Frequently Asked Questions
What Is the Most Accurate Momentum Indicator?
The most accurate momentum indicator is the Relative Strength Index (RSI). It excels at pinpointing overbought and oversold conditions, providing crucial insights in market analysis. RSI's precision in identifying momentum shifts makes it a top choice for traders.
What Is the Best Indicator for the Bear Market?
To determine the best indicator for a bear market, consider the Relative Strength Index (RSI) for price change identification, Stochastic Oscillator for overbought/oversold signals, Moving Averages for trend analysis, and Flag Patterns for momentum assessment. Web Trader Platforms provide real-time market data.
What Is the Momentum Strategy in the Bear Market?
In a bear market, understanding the momentum strategy involves seizing short-term opportunities amidst downward trends. By employing indicators like RSI, MACD, and Stochastic Oscillator, you can confirm bearish trends and pinpoint entry/exit points effectively.
What Is the Best Setting for the Momentum Indicator?
In assessing momentum indicators, a 14-period setting is often favored for its balanced view and reliability. This setting captures short to medium-term momentum shifts effectively. Adjusting periods can impact sensitivity and signal accuracy in bearish markets.
Conclusion
In conclusion, mastering the top five momentum indicators for bearish markets can be a game-changer for traders looking to navigate challenging market conditions. By incorporating these tools into your analysis, you can confidently identify trends, make informed decisions, and potentially capitalize on opportunities even in a declining market.
Embracing these indicators can elevate your trading strategies and help you stay ahead of the curve. Happy trading!