
The Parabolic SAR indicator is a widely used tool in the realm of technical analysis, offering traders valuable insights into market trends and potential reversals. Its ability to provide clear signals for setting stop-loss orders and capturing substantial price movements makes it a favored choice among traders seeking to optimize their strategies.
However, the real question remains: why should traders incorporate this indicator into their arsenal? Let's explore the key advantages and considerations that make the Parabolic SAR a compelling tool for traders navigating dynamic market conditions.
Benefits of Parabolic SAR Indicator
How does the Parabolic SAR indicator offer traders a reliable tool for identifying potential trend reversals and determining optimal entry and exit points in the financial markets?
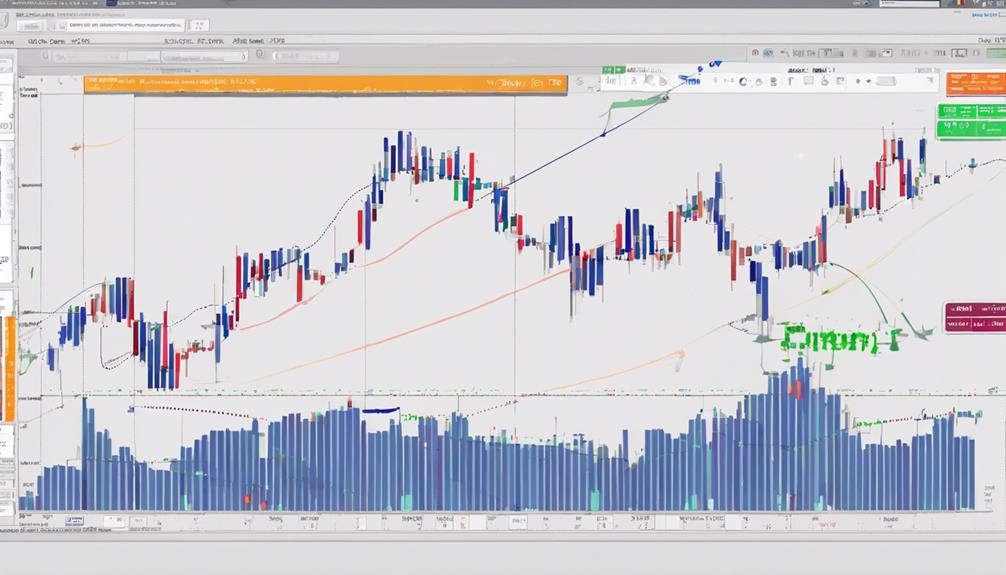
The Parabolic SAR, or Stop and Reverse, is an effective technical analysis tool that provides traders with visual cues in the form of dots above or below price bars. These dots indicate potential trend reversals, making it easier for traders to adjust their positions accordingly. Moreover, the Parabolic SAR can be utilized to set trailing stop-loss orders, helping traders capture profits while safeguarding against potential market reversals.
Traders often incorporate the Parabolic SAR into their trading strategies due to its simplicity and versatility across various financial instruments in trending markets. By combining the Parabolic SAR with other technical indicators, traders can enhance their decision-making processes and create more robust trading strategies. Overall, the Parabolic SAR serves as a valuable tool for traders seeking to optimize their entry and exit points, manage risk through stop-loss orders, and capitalize on trend momentum effectively.
Parabolic SAR Calculation Process
The calculation of the Parabolic SAR indicator involves utilizing an Acceleration Factor (AF) and Extreme Price (EP) to determine the positioning of the indicator in relation to price movements. In an uptrend, the EP is the highest high, while in a downtrend, it is the lowest low.
The default AF is commonly set at 0.02, but it can be customized, with some platforms allowing adjustments up to 0.20. The calculation process of the Parabolic SAR formula ensures that the SAR adapts to price movements accordingly, reflecting the dynamic nature of the market.
Understanding this calculation process is crucial for traders as it influences the interpretation of the Parabolic SAR indicator. By comprehending how the indicator is derived, traders can effectively utilize it to identify potential trend reversals, confirm trends, and set trailing stop-loss orders.
Customizing the AF can also help tailor the indicator to specific trading styles and preferences, enhancing its usefulness in different market conditions.
Using Parabolic SAR for Trading
Utilizing the Parabolic SAR indicator in trading provides traders with a valuable tool for identifying potential trend reversals and optimizing entry and exit points in the market. When it comes to Parabolic SAR trading, here are some key points to consider:
- Technical Indicator: Parabolic SAR is a technical indicator developed by Welles Wilder Jr.
- Price Movements: It helps traders analyze price movements and potential trend changes.
- Market Signals: The indicator provides clear buy and sell signals based on the dots' position relative to price bars.
- Trending Markets: Particularly useful in trending markets for setting trailing stop-loss orders.
- Stop and Reverse: The indicator's name stems from its ability to suggest when to stop and reverse a position based on price action.
Strategies With Parabolic SAR
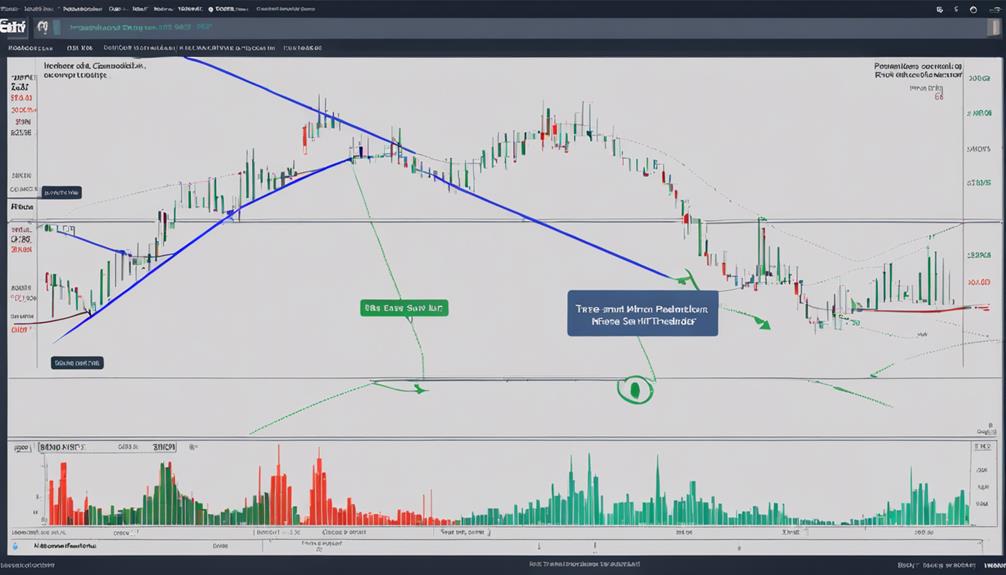
When implementing trading strategies with the Parabolic SAR indicator, it is essential to consider various complementary indicators for enhancing signal confirmation and decision-making accuracy. Traders often combine the Parabolic SAR with moving averages, such as the 40-period and 20-period moving averages, to validate trend directions and filter out false signals in financial markets. Backtesting different strategies involving the Parabolic SAR can help traders identify the most effective approach that aligns with their trading style and risk tolerance. Incorporating additional technical indicators like the Average Directional Index (ADX) alongside the Parabolic SAR can further strengthen the confirmation of trading signals.
Effective strategies utilizing the Parabolic SAR typically focus on trending markets where the indicator performs best. By integrating the Parabolic SAR with other technical tools and indicators, traders can enhance their decision-making process and improve the accuracy of their trading strategies. The synergy between the Parabolic SAR and complementary indicators underscores the importance of a comprehensive and well-thought-out approach to technical analysis in developing successful trading strategies.
Enhancing Trading Decisions With Parabolic SAR
Enhancing trading decisions with the Parabolic SAR indicator involves leveraging its capabilities to optimize entry and exit points in volatile market conditions. Traders can benefit from the following strategies to enhance their decision-making process:
- Setting Effective Stop Loss: Utilize Parabolic SAR to set trailing stop-loss orders that adjust with price movements, protecting profits and minimizing losses.
- Identifying Trend Direction: The visual cues provided by Parabolic SAR, such as dots above or below price bars, offer valuable insights into the direction of trends, aiding in decision-making.
- Utilizing Other Indicators: Combining Parabolic SAR with moving averages or other technical indicators can provide a more comprehensive view of the market, leading to informed trading signals.
- Maximizing Profit Potential: By capturing high-momentum moves in trending markets, traders can capitalize on opportunities to maximize profits efficiently.
- Informed Decision-Making: Understanding market conditions and incorporating Parabolic SAR signals into technical analysis can lead to more informed trading decisions, supported by data and market commentary.
Is the Effectiveness of the Parabolic SAR Indicator the Reason for Using It?
Many traders believe that the parabolic SAR indicator effectiveness is the reason for using it in their analysis. This technical tool helps identify potential trend reversals, making it valuable in predicting price movements. Its ability to provide clear signals and straightforward interpretation makes it a popular choice among traders.
Frequently Asked Questions
What Are the Advantages of Parabolic Sar?
Parabolic SAR offers traders advantages such as precise trend reversal identification, clear entry and exit signals, effective trailing stop-loss implementation, user-friendly interpretation for all experience levels, and enhanced accuracy when used alongside other indicators for confirming signals.
How Accurate Is the Parabolic SAR Indicator?
The accuracy of the Parabolic SAR indicator varies based on market conditions. It excels in strong trending markets but may produce false signals in sideways trends. Combining it with other indicators enhances accuracy. Understanding market trends is crucial for optimal application.
What Is the Best Timeframe for Parabolic Sar?
The optimal timeframe for Parabolic SAR hinges on trading style and objectives. Shorter periods suit day traders chasing quick trends, while longer spans cater to swing traders and investors eyeing broader market shifts. Tailoring the timeframe aligns strategy with preferences.
What Is the Best Strategy for Parabolic Sar?
The best strategy for Parabolic SAR involves confirming signals with complementary indicators like moving averages or ADX. Combining Parabolic SAR with specific periods of moving averages can filter out false signals and enhance accuracy, aiding traders in making informed decisions.
Conclusion
In conclusion, the Parabolic SAR indicator serves as a valuable tool for traders seeking to identify trend direction and potential reversals in asset prices.
Like a compass guiding a ship through stormy seas, the Parabolic SAR helps traders navigate volatile markets with trailing stop-loss orders and well-informed decisions.
By understanding its calculation process and utilizing it in conjunction with other indicators, traders can enhance their trading strategies and make more informed decisions in the financial markets.