
The Parabolic SAR indicator is a renowned tool among novice traders seeking to navigate the complexities of market trends and potential reversals. As a creation of J. Welles Wilder Jr., this indicator's mechanism of trailing stops and reversals manifests as a sequence of dots on a chart, strategically positioned in alignment with price movements.
However, while it offers valuable insights into market dynamics, understanding its nuances and limitations is crucial. By exploring the intricacies of the Parabolic SAR indicator and its practical implications, traders can equip themselves with a valuable asset in their trading arsenal.
Definition and Purpose of Parabolic SAR Indicator
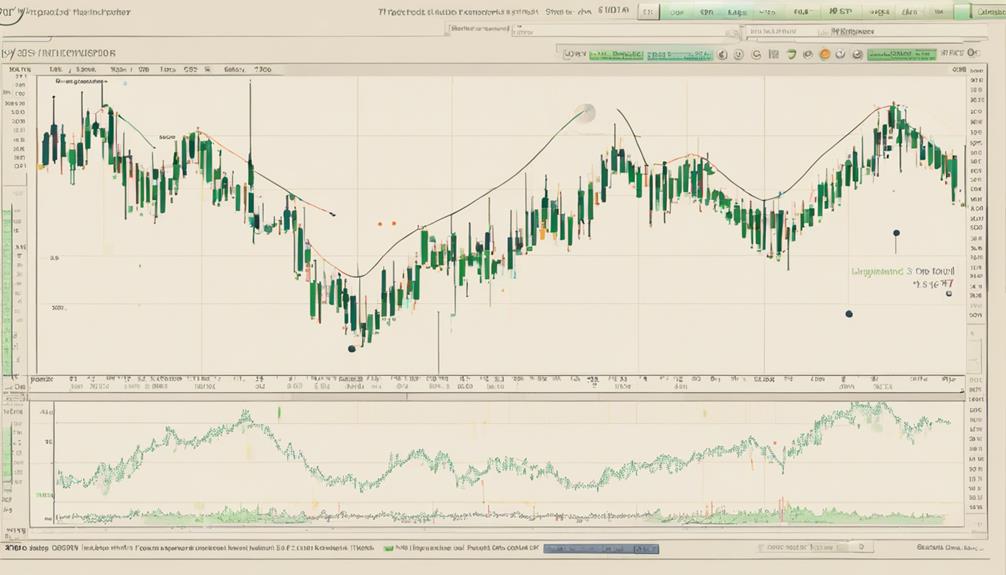
The Parabolic SAR indicator, a technical analysis tool developed by J. Welles Wilder, serves as a valuable aid for traders seeking to identify trend directions and potential reversal points in financial markets. This indicator works by plotting dots either above or below price bars, signifying potential trend reversals.
The Parabolic SAR is particularly useful in setting effective stop-loss orders as it dynamically adjusts its position based on price movements. Traders often interpret the position of these dots to determine the current trend in the market. When the dots switch positions from below to above the price bars, it can signal a potential downtrend, and vice versa for an uptrend.
The Parabolic SAR's trailing stop method helps traders lock in profits and protect against significant losses. However, it is essential to note that this indicator is most effective in trending markets and may provide misleading signals during sideways or choppy price actions. Understanding the interpretation and application of the Parabolic SAR is crucial for making informed trading decisions.
Understanding Parabolic SAR Formula
Building upon the foundational knowledge of the Parabolic SAR indicator's purpose and significance, comprehending the Parabolic SAR formula is essential for traders looking to leverage this technical analysis tool effectively.
The Parabolic SAR formula calculates the SARNEW using the SARCURRENT, Acceleration Factor (AF), and Extreme Point (EP). The AF, starting at 0.02, increases by 0.02 up to a maximum of 0.2 in the formula. The EP plays a crucial role in determining the values in the formula and guiding the path of a trending market.
Automated calculation of the Parabolic SAR is available in trading platforms like MetaTrader, enhancing convenience for traders. Understanding the components of the formula is paramount for interpreting Parabolic SAR signals accurately.
Interpreting Parabolic SAR Signals
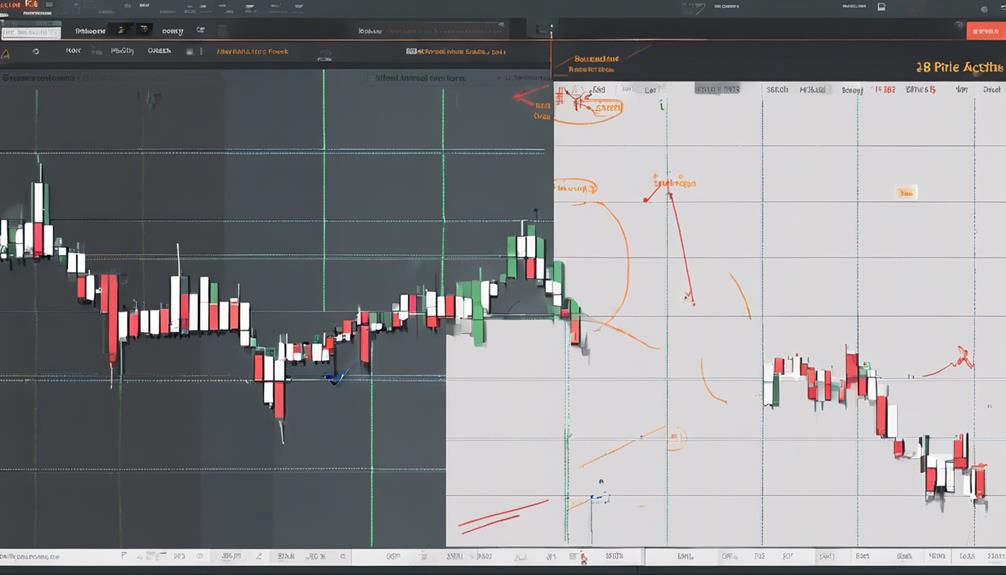
An essential aspect in effectively utilizing the Parabolic SAR indicator is the interpretation of its signals, which provide valuable insights into potential trend reversals in the market. When interpreting Parabolic SAR signals, traders observe the movement of dots in relation to price bars. Dots shifting positions above price bars signal a potential downtrend, while dots moving below indicate a possible uptrend.
The indicator generates buy signals when dots transition below price bars, suggesting a favorable entry point, and sell signals when dots switch above, indicating a potential exit opportunity. By understanding how the Parabolic SAR interprets price movements, traders can make informed decisions regarding setting stop-loss orders to manage risk effectively based on trend changes.
This comprehension of Parabolic SAR signals is instrumental in navigating market fluctuations and seizing opportunities for profitable trading strategies.
Parabolic SAR Vs. Moving Average
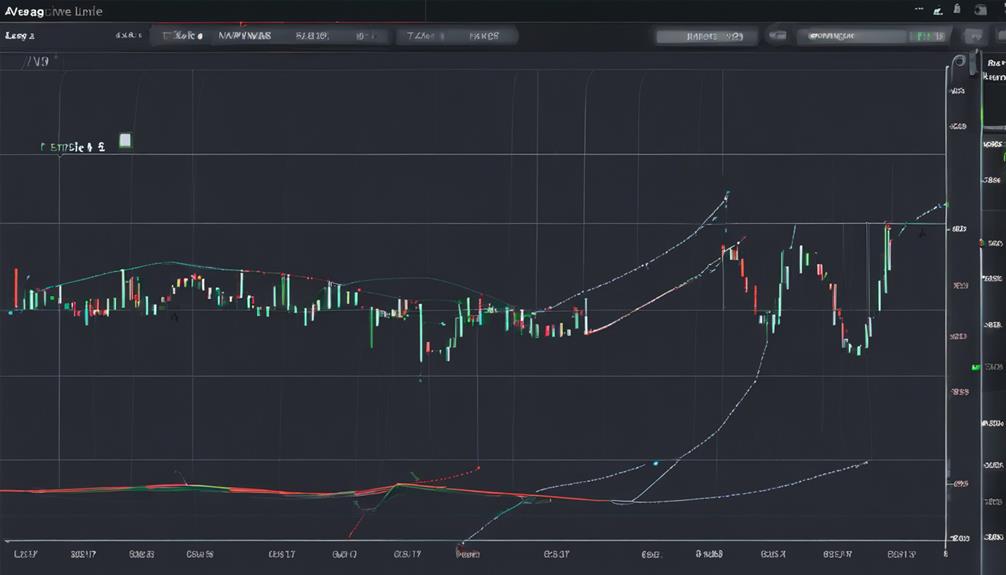
Comparing the Parabolic SAR indicator with Moving Averages reveals distinctive characteristics that cater to different aspects of market analysis and trend identification. The Parabolic SAR is more sensitive to price changes compared to Moving Averages, reacting quickly to trends and offering timely signals directly related to price action.
In contrast, Moving Averages smooth out price data over a specified period, functioning as lagging indicators that follow past price data. The Parabolic SAR anticipates potential reversals, making it valuable for traders looking to capture shifts in market direction.
Combining Moving Averages with Parabolic SAR can provide a more comprehensive trend analysis, as Moving Averages help confirm signals generated by the Parabolic SAR. This synergy between the two indicators can enhance traders' understanding of price movements and improve decision-making processes in the dynamic realm of financial markets.
Practical Tips for Using Parabolic SAR
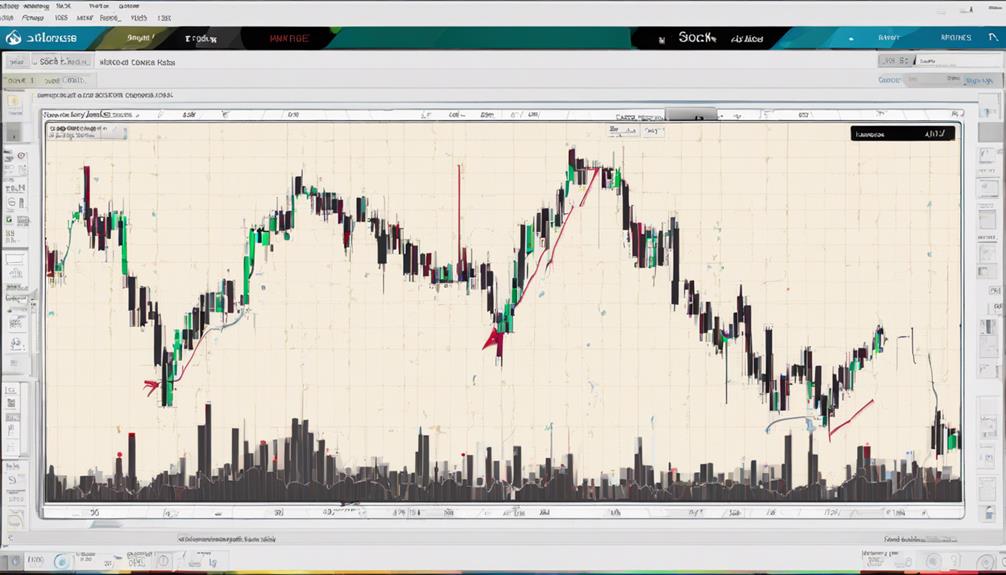
In practical application, utilizing the Parabolic SAR indicator effectively involves understanding key strategies for optimizing its use in market analysis and decision-making. To enhance the effectiveness of Parabolic SAR, consider the following practical tips:
- Implement Effective Stop-loss: Utilize the Parabolic SAR dots as stop-loss levels to manage risk efficiently.
- Utilize Trend-following Strategies: Interpret SAR dots above price as a potential downtrend and dots below price as an uptrend to align with market trends.
- Combine with Other Indicators: Use Parabolic SAR in conjunction with other indicators for better confirmation of trade signals.
- Adapt to Market Conditions: Understand the current market conditions and adjust trading strategies accordingly to maximize the benefits of the Parabolic SAR indicator.
Can Beginners Use Parabolic SAR Indicators for Day Trading?
Many top day traders recommend using the top Parabolic SAR indicators for beginners. These indicators can help simplify the trading process by providing clear entry and exit signals. With a basic understanding of how they work, beginners can effectively incorporate them into their day trading strategies.
Frequently Asked Questions
How Do You Use a Parabolic SAR Indicator?
To use a Parabolic SAR indicator effectively, traders should closely monitor the dots' placement relative to price bars. Dots below indicate an upward trend, while dots above signal a downward trend. This tool aids in setting stop-loss orders and making informed trading decisions.
What Is the Best Value for Parabolic Sar?
Determining the optimal Acceleration Factor (AF) value for the Parabolic SAR indicator involves weighing sensitivity against responsiveness. A judicious selection, akin to finding the sweet spot in a melody, aligns with one's trading strategy, timeframe, and risk tolerance.
What Is the Best SAR Indicator Setting?
When determining the best Parabolic SAR indicator setting, consider a Step value of 0.02 and a Maximum value of 0.20 as a starting point. Fine-tune these settings based on your trading style, timeframe, and asset for optimal performance.
What Time Frame Works Best for Parabolic Sar?
Shorter time frames like 1-hour or 4-hour charts work best for the Parabolic SAR indicator, offering frequent signals for day traders to make quick decisions. Adjusting time frames to match trading goals optimizes effectiveness and signal accuracy.
Conclusion
In conclusion, the Parabolic SAR indicator is a valuable tool for beginners in determining trend direction and potential reversals in price movements. By understanding the formula, interpreting signals, and comparing it to other indicators like moving averages, traders can make informed decisions in the market.
One interesting statistic to note is that studies have shown that the Parabolic SAR indicator performs best in trending markets, with an accuracy rate of over 70% in predicting price movements.