
You might not be aware that Bollinger Bands can offer valuable insights into market volatility and potential price movements.
As you navigate the world of trading, understanding how to effectively utilize these bands can be a game-changer for your strategy.
By grasping the nuances of Bollinger Bands tips, you can enhance your technical analysis skills and make more informed decisions in the dynamic realm of the financial markets.
Stay tuned to uncover practical insights that could shape your trading journey.
Bollinger Bands Basics
Explore the fundamental principles of Bollinger Bands to grasp their significance in understanding price volatility and potential market reversals.
Bollinger Bands consist of three lines: the upper Bollinger Bands, the lower Bollinger Bands, and the middle band, which is a simple moving average (SMA). These bands are calculated based on two standard deviations from the SMA, expanding and contracting with market volatility.
By analyzing these bands, traders can identify potential trading opportunities and determine overbought and oversold levels in the market. The upper band represents potential resistance levels, while the lower band indicates possible support levels.
Understanding the basics of Bollinger Bands equips you with essential tools to interpret price movements and anticipate market reversals effectively.
Parameters for Bollinger Bands
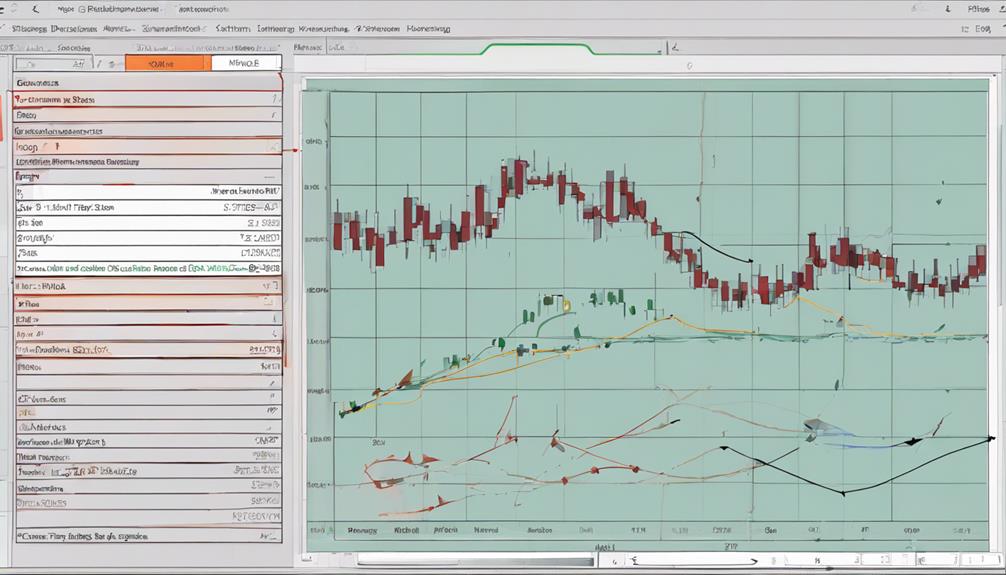
When setting up Bollinger Bands, adjusting the multiplier value from the default of 2 can impact the width and sensitivity of the bands to market volatility. The multiplier value influences the distance between the upper and lower bands, affecting the bands' responsiveness to price movements and changes in asset volatility.
Changing the multiplier value alters the band width and sensitivity to market fluctuations.
A higher multiplier value increases the band width, making the bands less sensitive to price changes.
Conversely, a lower multiplier value decreases the band width, increasing sensitivity to price movements.
Adjusting the multiplier can help traders customize Bollinger Bands to suit different asset volatilities.
Finding the right multiplier value is crucial for effectively using Bollinger Bands to identify entry and exit points.
Interpreting Bollinger Bands
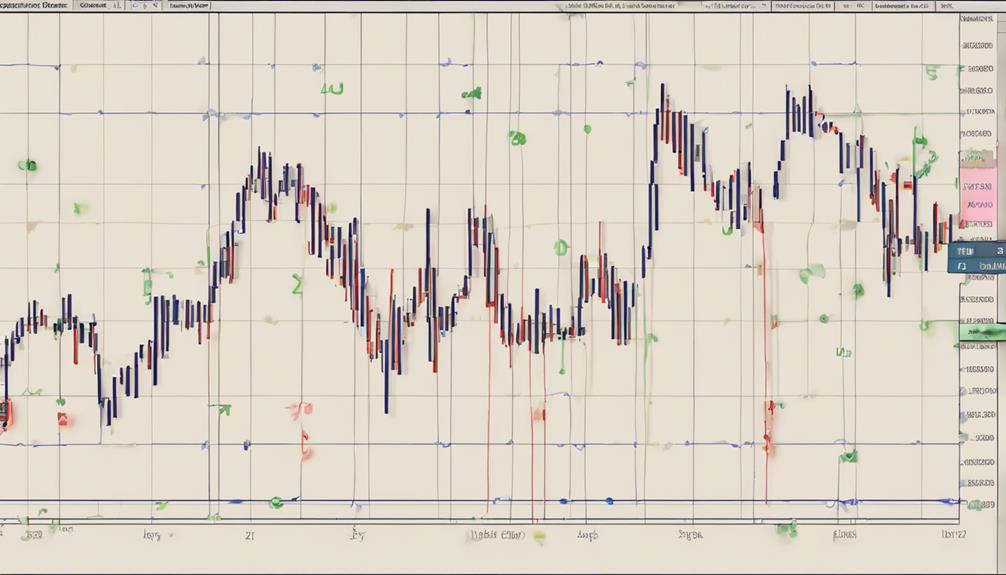
Interpreting Bollinger Bands involves analyzing the relationship between price movements and the bands' volatility indicators to assess market conditions. The upper band, calculated as the middle band + (2 x standard deviation), and the lower band, calculated as the middle band – (2 x standard deviation), serve as boundaries reflecting price volatility. These bands help identify overbought and oversold market conditions.
When the price touches the upper band, it may indicate an overbought situation, while touching the lower band could suggest an oversold condition. By observing the position of the price in relation to the bands, traders can anticipate potential price reversals and identify trade opportunities. Understanding these dynamics can assist you in making more informed trading decisions.
Trading With Bollinger Bands
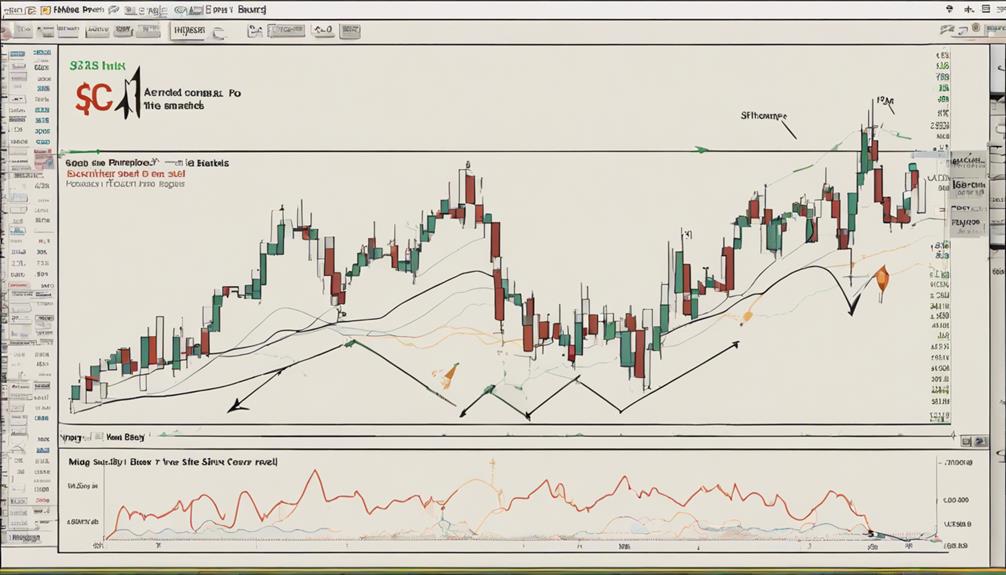
Utilizing Bollinger Bands in trading allows traders to pinpoint potential entry and exit points based on price volatility indicators. When trading with Bollinger Bands, consider the following:
- Identify Overbought and Oversold Levels: Use the upper band to spot overbought conditions and the lower band for oversold conditions.
- Utilize Standard Deviation: Understand that the width of the bands is determined by the standard deviation, reflecting market volatility.
- Focus on the Middle Band: The middle band, a 20-day SMA, can serve as a guide for the overall price trend.
- Analyze Price Action: Observe how prices interact with the bands to identify potential trading opportunities.
- Develop a Strategy: Create a trading plan based on Bollinger Bands to manage risk and optimize your entries and exits.
What Are Some Easy-to-Understand Tips for Using Bollinger Bands Effectively?
When it comes to bollinger bands usage tips, it’s important to keep it simple. Start by understanding the basic concept of the bands and how they indicate market volatility. Use them to identify potential entry and exit points for trades. Also, consider combining them with other technical indicators for confirmation.
How Can I Use Bollinger Bands Effectively?
To use effective Bollinger Bands tips, first understand that they measure volatility and identify overbought or oversold conditions. Use them in conjunction with other indicators for confirmation. Adjust the settings to fit your trading style. Stay disciplined and patient to avoid false signals. Always backtest your strategies.
Strategies for Bollinger Bands
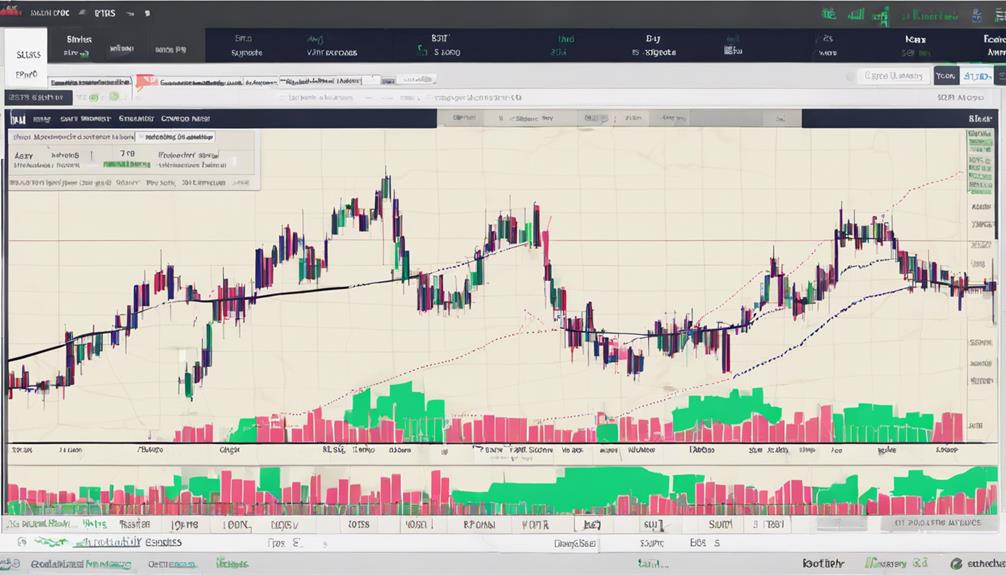
To effectively implement strategies for Bollinger Bands, traders must consider the diverse applications of this technical analysis tool in different market scenarios. Bollinger Bands can signal overbought and oversold conditions, guide trend following approaches, and help identify potential breakout opportunities.
Utilizing Bollinger Bands alongside indicators like the Relative Strength Index (RSI) can enhance trading signals and validate trend reversals. Traders often use the Bollinger Bands squeeze strategy during low volatility periods to anticipate potential breakout movements.
These bands also assist in setting appropriate stop-loss levels based on market volatility, allowing traders to manage risk effectively. Understanding how Bollinger Bands react to various market conditions is crucial for making informed trading decisions.
Frequently Asked Questions
How Do You Read and Understand Bollinger Bands?
To read and understand Bollinger Bands, focus on the middle line (simple moving average) and upper/lower bands showing price volatility. Bands expand in volatile markets and contract in less volatile ones, aiding in spotting entry/exit points.
What Are Bollinger Bands for Dummies?
Bollinger Bands for dummies help you grasp market momentum. Understand them as volatility indicators; the wider the bands, the higher the volatility. When prices touch the bands, it suggests potential reversals. Stay alert for trading signals.
What Time Frame Is Best for Bollinger Bands?
For Bollinger Bands, pick a time frame that fits your strategy: short-term traders go for 5-minute charts; swing traders opt for 1-hour frames; long-term investors analyze trends on daily or weekly charts. Experiment wisely.
What Are the Best Settings for the Bollinger Bands for a 5-Minute Chart?
For a 5-minute chart, use a 20-period SMA with 2 standard deviations for Bollinger Bands. This setting suits short-term price movements and volatility analysis. Adjust based on your trading style and asset. It helps pinpoint intraday entry/exit points effectively.
Conclusion
In conclusion, mastering Bollinger Bands can be a game-changer for your trading strategy. Remember, 'the trend is your friend,' so use Bollinger Bands to identify trends and potential reversals in the market.
By customizing settings, interpreting signals, and implementing strategic trades, you can maximize your profits and minimize risks. Keep learning, adapting, and refining your approach to make the most of this powerful technical indicator.
Happy trading!