
Exploring the top 10 insights surrounding the Parabolic SAR Indicator for trend trading unveils a wealth of strategic possibilities and nuanced understandings. From dissecting its calculation methodology to unraveling the intricacies of interpreting signals, this tool offers traders a comprehensive view of market dynamics.
Delving into the best practices for optimizing its performance and the potential pitfalls to watch out for can provide traders with a competitive edge in navigating the complexities of trend trading.
Understanding how to harness the power of the Parabolic SAR Indicator can significantly enhance one's trading arsenal and decision-making capabilities in the ever-evolving financial landscape.
Parabolic SAR Indicator Overview
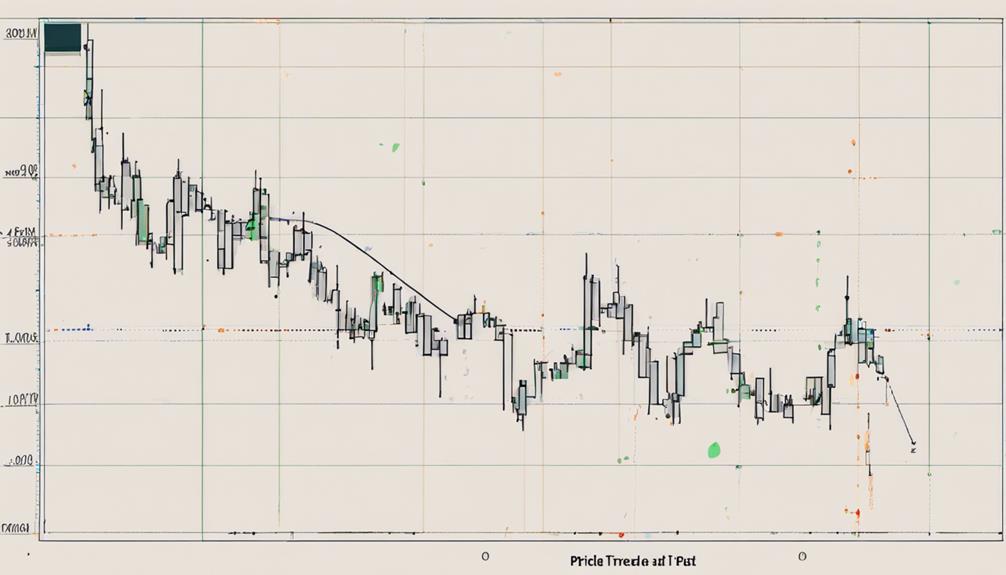
The Parabolic SAR indicator, developed by J. Welles Wilder Jr., is a powerful tool designed specifically for trend trading, offering traders valuable insights into market dynamics. This indicator is particularly useful for determining the direction of a trend and potential entry and exit points in the market. The Parabolic SAR setting involves calculations based on price highs and lows, as well as an acceleration factor that can be adjusted to suit the trader's preferences for sensitivity.
Traders use the Parabolic SAR to identify the beginning of new trends and to place stop-loss orders effectively. When the SAR is below the price, it indicates an uptrend, while a SAR above the price suggests a downtrend. The dots of the SAR indicator act as moving stop-loss levels that traders can follow as the trend progresses. This feature makes it a valuable tool for managing risk and maximizing profits in trend trading strategies.
Calculating Parabolic SAR
Utilizing a dynamic formula incorporating the Acceleration Factor (AF) and Extreme Price (EP), the Parabolic SAR indicator calculates its positioning for the subsequent period, adapting to changing market trends. The calculation involves updating the SAR value based on the previous SAR, the current AF, the EP, and the direction of the trend. This dynamic nature of the Parabolic SAR enables it to act as a trailing stop, adjusting levels in response to price movements. Understanding the calculation process is crucial for traders to effectively interpret the indicator's signals and make informed decisions regarding their positions.
The Parabolic SAR formula incorporates the previous SAR value, the Acceleration Factor (AF), and the Extreme Price (EP).
The AF, starting at 0.02, increases by 0.02 each time a new extreme point is reached, capped at 0.20.
Calculation of the Parabolic SAR adapts dynamically to market conditions, providing traders with valuable insights into trend signals and potential reversal points.
Interpreting Parabolic SAR Signals
Interpreting Parabolic SAR signals involves recognizing the potential for trend reversals indicated by three consecutive dots changing position.
Timing entry points and confirming trend continuation can be achieved through analyzing the relationship between the SAR dots and price action.
Traders can enhance signal accuracy by incorporating the 200-period moving average to filter out false signals and make more informed trading decisions.
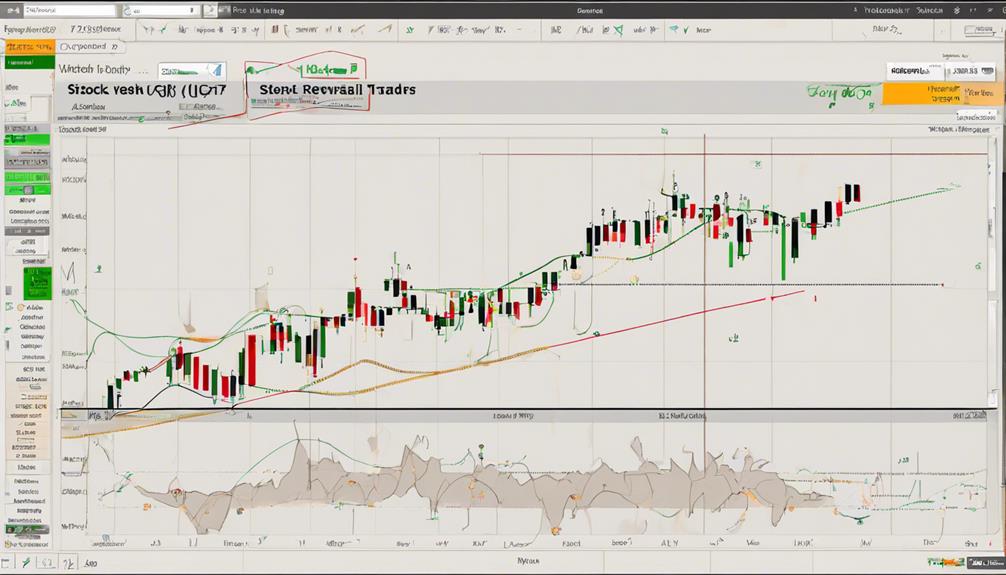
SAR Signal Reversal
Recognizing Parabolic SAR signal reversals plays a vital role in guiding traders to adjust their positions effectively in response to changing market trends. When it comes to SAR signal reversals, there are key points to consider:
- Parabolic SAR signals a trend reversal when dots transition from above to below the price, indicating a shift from a downtrend to an uptrend.
- Traders should adjust their positions when the price crosses the Parabolic SAR dots, signaling a potential trend reversal.
- Confirmation of a reversal signal occurs when the dots switch positions and align with the price movement in the opposite direction.
Understanding these mechanics is essential for traders to validate trend reversals and maximize trading opportunities efficiently.
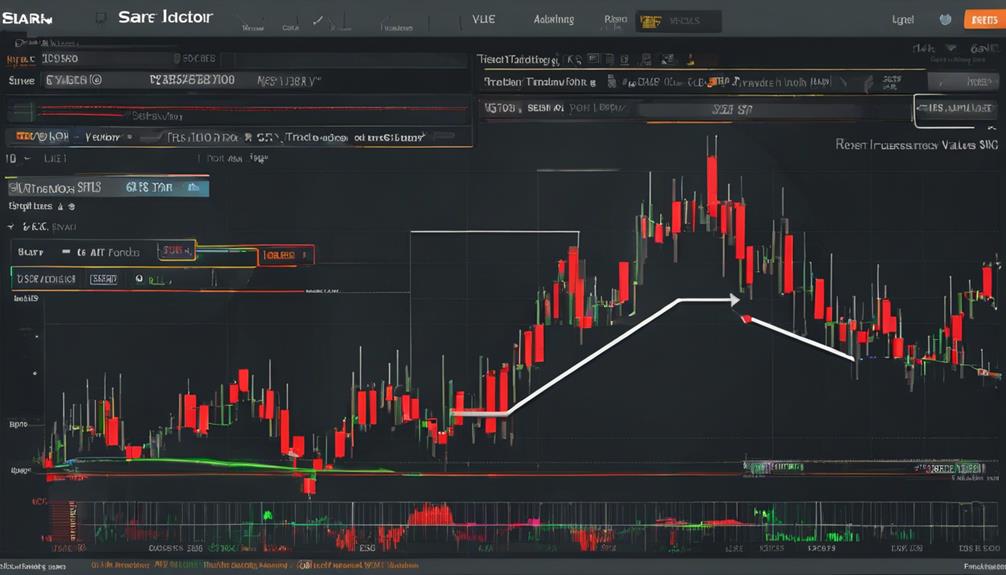
Timing Entry Points
Efficiently timing entry points based on Parabolic SAR signals requires a keen understanding of price movements and dot placements relative to candlesticks. To achieve accurate entries, traders utilize the Parabolic SAR in conjunction with the 200 period moving average to filter out false signals and pinpoint precise entry timing.
Interpreting signals correctly hinges on recognizing the significance of dot placements concerning price candles. By grasping these dynamics, traders can enhance their trading strategy by entering and exiting trades with greater precision.
Achieving a deep comprehension of how Parabolic SAR signals interact with price action enables traders to make informed decisions and capitalize on favorable market movements, leading to more profitable outcomes in the long run.
Trend Continuation Confirmation
To ascertain the validity of trend continuation when utilizing the Parabolic SAR indicator, traders meticulously observe the alignment of its dots with the prevailing trend to gauge the momentum effectively. When interpreting Parabolic SAR signals for trend continuation confirmation, traders focus on specific aspects:
- Dots Position: The position of Parabolic SAR dots relative to price candles indicates the current trend direction.
- Series Flipping: A series of dots changing position in relation to price candles signifies a potential trend reversal.
- Alignment Analysis: Traders analyze the alignment of Parabolic SAR dots with the prevailing trend to validate trend momentum for making informed trading decisions.
Analyzing Parabolic SAR signals alongside price action is crucial for confirming trend continuation and identifying optimal entry and exit points.
Parabolic SAR Trading Strategies
Effective Parabolic SAR trading strategies revolve around utilizing SAR entry signals to initiate positions and SAR exit strategies to manage trades efficiently.
By understanding how to interpret these signals and incorporating them into a trading plan, traders can enhance their decision-making process and increase the probability of successful trades.
Combining these strategies with sound risk management practices can lead to more consistent and profitable trading outcomes.
SAR Entry Signals
When implementing Parabolic SAR trading strategies, key focus is placed on interpreting SAR entry signals, which are generated through the flipping position of dots above or below the price candles.
Flipping dots indicate potential entry points in the Parabolic SAR strategy.
Confirmation of entry signals can be obtained by analyzing the price action alongside the SAR signals.
The 200 period moving average serves as a useful tool to filter out false entry signals, enabling traders to make optimal buy or sell decisions based on whether the price is above or below the moving average.
SAR Exit Strategies
In the realm of trend trading strategies using the Parabolic SAR indicator, the focus shifts to SAR Exit Strategies, crucial for maximizing gains and managing risk effectively in trading scenarios. SAR exit strategies involve utilizing Parabolic SAR dots to identify optimal points to exit trades, especially when the dots flip, indicating a potential trend reversal.
By implementing trailing stops based on Parabolic SAR levels, traders can secure profits and manage risk efficiently. These strategies emphasize capitalizing on trend changes to maximize gains while mitigating potential losses.
Leveraging Parabolic SAR for exit signals enhances trade efficiency, offering traders a systematic approach to navigating trend fluctuations and making informed decisions to optimize their trading outcomes.
Best Settings for Parabolic SAR
Optimal customization of the Acceleration Factor (AF) in the Parabolic SAR indicator is crucial for tailoring its sensitivity to different timeframes and market conditions. Adjusting the AF value can significantly impact the performance of the indicator, allowing traders to adapt to changing trends efficiently.
Here are some key considerations for determining the best settings for Parabolic SAR:
- The default settings usually have an AF of 0.02, providing a balanced level of sensitivity.
- Traders have the flexibility to increase the AF up to a maximum of 0.20 for greater responsiveness to price movements.
- Shorter timeframes often benefit from lower AF values, while longer timeframes may require higher AF settings to capture more significant trend changes.
Experimenting with various AF values enables traders to fine-tune the Parabolic SAR indicator for optimal performance across different market conditions. By understanding how the AF impacts sensitivity, traders can effectively utilize this tool to enhance their trend trading strategies.
Using Parabolic SAR in MetaTrader 4
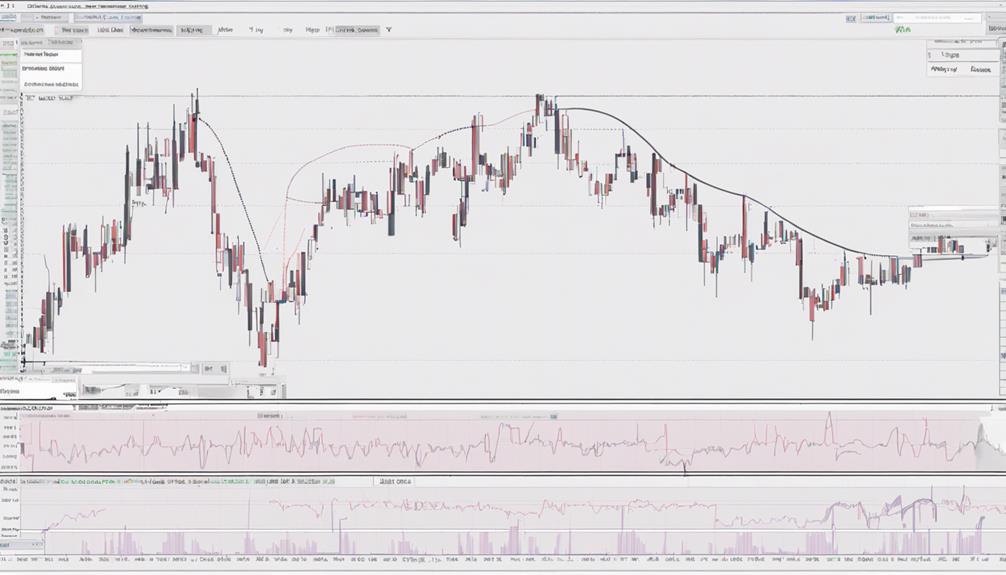
Utilizing the Parabolic SAR indicator within the MetaTrader 4 platform offers traders a robust tool for trend analysis and decision-making.
MetaTrader 4 provides traders with the flexibility to customize Parabolic SAR settings and parameters, allowing for optimal performance tailored to individual trading strategies. Moreover, traders can leverage the platform's capabilities to conduct multi-timeframe analysis using Parabolic SAR, enabling a comprehensive view of the market trends across different time frames.
Within MetaTrader 4, traders can explore variations like Parabolic SAR Color Alert for enhanced trend identification, providing visual cues for potential entry and exit points. Additionally, the Parabolic SAR indicator in MetaTrader 4 offers valuable insights into trend strength and can assist in setting stop-loss levels effectively, aiding traders in risk management strategies.
The customization options available within MetaTrader 4 empower traders to adapt the Parabolic SAR indicator to their specific trading preferences, enhancing overall trading decisions and outcomes.
Pros and Cons of Parabolic SAR
The Parabolic SAR indicator offers traders clear signals for entry and exit points, making it a valuable tool for trend trading strategies.
However, its effectiveness can be limited in choppy or sideways markets where false signals may occur more frequently.
Traders should consider the advantages of using Parabolic SAR in trending markets while also being mindful of its drawbacks in non-trending conditions.
Advantages of Parabolic SAR
An examination of the Parabolic SAR indicator reveals its advantages:
- Provides clear buy and sell signals for trend traders.
- Aids in risk management through setting effective stop-loss levels.
- User-friendly nature suitable for traders of all skill levels.
Traders should be aware that Parabolic SAR performs best in trending markets, potentially giving false signals in sideways or choppy markets. To enhance accuracy, it is recommended to combine Parabolic SAR with other indicators for confirmation and continuous strategy evaluation.
Limitations of Parabolic SAR
What are the fundamental drawbacks of the Parabolic SAR indicator that traders must consider when implementing trend trading strategies effectively?
While Parabolic SAR is valuable in trending markets, it can produce false signals in sideways markets, leading to potential entry and exit mistakes. To mitigate this risk, traders should use Parabolic SAR in conjunction with confirmation indicators to enhance accuracy.
Relying solely on Parabolic SAR for entry and exit points without proper risk management can be detrimental, especially in ranging or choppy markets. Understanding the limitations of Parabolic SAR is crucial for successful trend trading strategies.
Traders should exercise caution and employ proper risk management techniques to navigate the challenges posed by the indicator's limitations effectively.
Considerations for Using
Considerations for utilizing the Parabolic SAR indicator in trend trading encompass both advantages and disadvantages that traders must carefully evaluate to optimize their strategies effectively.
- The indicator is effective in identifying trend reversals promptly.
- It assists in setting precise stop-loss orders to manage risk efficiently.
- Parabolic SAR provides clear buy and sell signals, aiding traders in determining optimal entry and exit points in the market.
Testing Parabolic SAR Performance
Evaluating the performance of the Parabolic SAR indicator through rigorous testing on Heikin Ashi charts reveals a notable 63% success rate in generating buy and sell signals. When applied to Heikin Ashi charts, the Parabolic SAR indicator demonstrates improved efficacy, particularly in trending markets. This approach can enhance trading profitability by increasing the win rate to 63%, indicating its potential as a valuable tool for trend traders.
Additionally, combining Parabolic SAR with Heikin Ashi charts helps reduce false signals, further strengthening its utility in decision-making processes. Conversely, the use of Parabolic SAR on OHLC charts is associated with lower success rates, emphasizing the advantage of employing Heikin Ashi charts for better results.
Combining Parabolic SAR With Other Indicators
By integrating Parabolic SAR with various technical indicators, traders can enhance their trend analysis and make more informed decisions in the dynamic financial markets. Combining indicators offers a holistic approach, allowing for a comprehensive understanding of market movements.
Here are three key ways in which Parabolic SAR can be effectively combined with other indicators:
- Confirm Trend Directions: Pairing Parabolic SAR with Moving Averages can help confirm the direction of a trend, providing additional confidence in trading decisions.
- Filter False Signals: Integrating Parabolic SAR with the RSI indicator enables traders to filter out false signals and focus on significant price movements.
- Analyze Trend Strength: Using Parabolic SAR alongside the MACD indicator allows traders to assess both trend strength and momentum shifts, providing valuable insights into market dynamics.
Parabolic SAR Tips and Tricks
Integrating Parabolic SAR into trading strategies requires a nuanced understanding of its functionality and application to maximize its effectiveness in trend analysis and decision-making.
When using the Parabolic SAR indicator, traders can benefit from its ability to identify potential trend reversals by observing the stop and reverse points it generates. By paying attention to the dots above or below price candles, traders can determine the market direction, aiding in making informed trading decisions.
Moreover, the indicator can be utilized to set precise stop-loss levels and implement trailing stops to effectively manage risk exposure. Clear buy and sell signals are also provided based on the relative position of the dots in relation to the price action.
For those employing trend trading strategies, the Parabolic SAR indicator offers valuable insights for identifying entry and exit points, ultimately assisting traders in navigating the dynamic nature of the market with more confidence and precision.
How Can the Parabolic SAR Indicator Help with Trend Trading?
The Parabolic SAR indicator is a useful tool for optimizing volatility trading strategy. It helps traders identify potential trend reversals and gives signals for entry and exit points. By incorporating the Parabolic SAR into their analysis, traders can make more informed decisions and enhance their trend trading approach.
Frequently Asked Questions
Which Indicator Is Best With Parabolic Sar?
When seeking optimal indicators to complement Parabolic SAR, consider the Moving Average Convergence Divergence (MACD) for trend confirmation, Relative Strength Index (RSI) for oversold/overbought levels, On Balance Volume (OBV) for volume analysis, and Donchian Channel for breakout identification.
What Is the Best Indicator for Trend Trading?
The Moving Average Convergence Divergence (MACD) indicator is highly regarded for trend trading. It combines trend-following and momentum elements to identify potential entry and exit points. By analyzing the relationship between two moving averages, MACD helps traders gauge trend strength effectively.
What Is the Success Rate of Parabolic SAR Indicator?
The success rate of the Parabolic SAR indicator varies, with an approximate 63% success rate for buy and sell signals. It is most effective when paired with Heikin Ashi charts, particularly in trending markets, enhancing trading accuracy and profitability.
What Is the Most Successful Trading Indicator?
When evaluating trading indicators, the Relative Strength Index (RSI) stands out as one of the most successful. It provides valuable insights into overbought or oversold conditions, aiding traders in making informed decisions based on market dynamics.
Conclusion
In the intricate tapestry of market analysis, the Parabolic SAR Indicator shines as a guiding star for trend trading strategies. Like a compass in a sea of volatility, it navigates traders through price highs and lows, offering valuable insights for decision-making.
However, just as a compass can falter in turbulent waters, traders must be vigilant of false signals and adapt their strategies accordingly.
The Parabolic SAR Indicator, with its nuances and complexities, remains a powerful tool in the arsenal of the discerning trader.