
The ROC indicator serves as a fundamental tool in stock analysis, offering valuable insights into market dynamics and potential trading opportunities. Its ability to gauge the speed of price changes enables traders to make informed decisions on entry and exit points, identify market trends, and pinpoint areas of price exhaustion.
But what sets the ROC indicator apart from other technical tools? Its adaptability to various market conditions and timeframes provides traders with a versatile means of navigating the complexities of stock trading. Understanding the significance of the ROC indicator can significantly enhance one's trading strategy and overall success in the stock market.
Importance of ROC Indicator
The significance of the Rate of Change (ROC) indicator in stock analysis lies in its ability to quantify the pace of price movements, offering traders valuable insights into market dynamics. As a technical indicator, ROC measures the percentage change in stock prices over a specific period, aiding traders in identifying overbought and oversold conditions in the market.
By tracking the momentum of price changes, ROC helps traders anticipate potential trend changes, providing crucial divergence signals that can guide timely buy or sell decisions. Understanding the ROC indicator enables traders to optimize their trade timing strategies, confirming trend directions and capitalizing on favorable market movements.
ROC Indicator Calculation
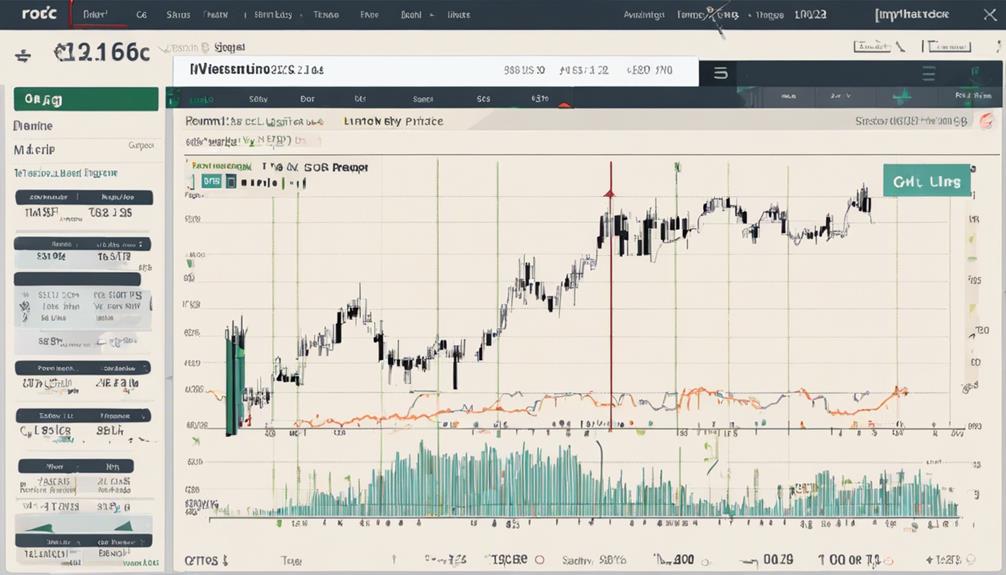
Given the significance of the Rate of Change (ROC) indicator in stock analysis for quantifying price movements, a crucial aspect to delve into is the calculation methodology of the ROC indicator. The ROC indicator calculates the percentage change in price between the current close and the close n periods ago using the formula [(Current Close – Close n periods ago) / Close n periods ago] X 100. Common n values used for ROC calculation include 14, 9, 25, and 200.
ROC values above zero indicate a bullish sentiment, while values below zero indicate a bearish sentiment. As a Momentum Indicator, ROC serves as an oscillator with no defined overbought or oversold levels, making it essential for analyzing stock momentum, trend changes, and price momentum. Traders often look for the ROC indicator moving upwards as it can signify potential buying opportunities. Understanding the ROC calculation is crucial for developing effective Trading Strategies based on this technical indicator.
Analyzing ROC for Stocks
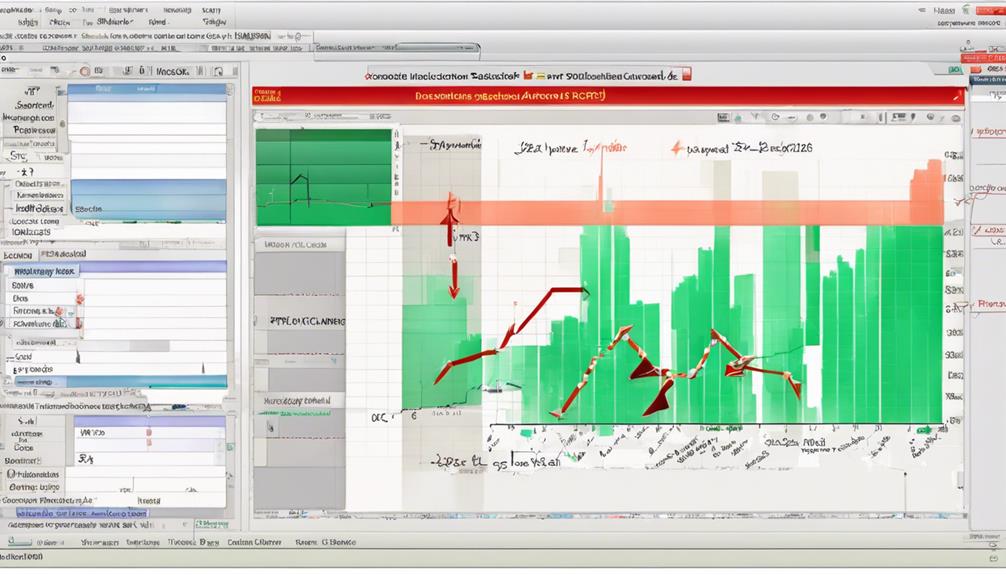
Analyzing the ROC indicator for stocks provides valuable insights into momentum shifts and potential trading opportunities based on price change rates over specific periods. The Rate of Change (ROC) is a key momentum oscillator used in technical analysis tools. By monitoring ROC values, traders can identify overbought or oversold conditions, confirming trends and potential reversals. This aids in determining optimal entry and exit points in stock trading.
However, a potential problem with using ROC alone is that it may generate false signals during sideways movements or choppy markets. Therefore, it is advisable to complement ROC analysis with other technical indicators for a more comprehensive assessment. When ROC values exhibit bullish momentum, traders may consider this as a signal to enter a trade.
ROC Indicator in Trading
Upon evaluating the ROC indicator in trading, it becomes evident that this tool plays a crucial role in pinpointing market conditions conducive for identifying potential trading opportunities and optimizing entry and exit points. Here is a breakdown to shed light on the significance of the ROC indicator:
- Identifying Overbought and Oversold Conditions: ROC helps traders recognize when a stock is overbought or oversold, indicating potential reversal points.
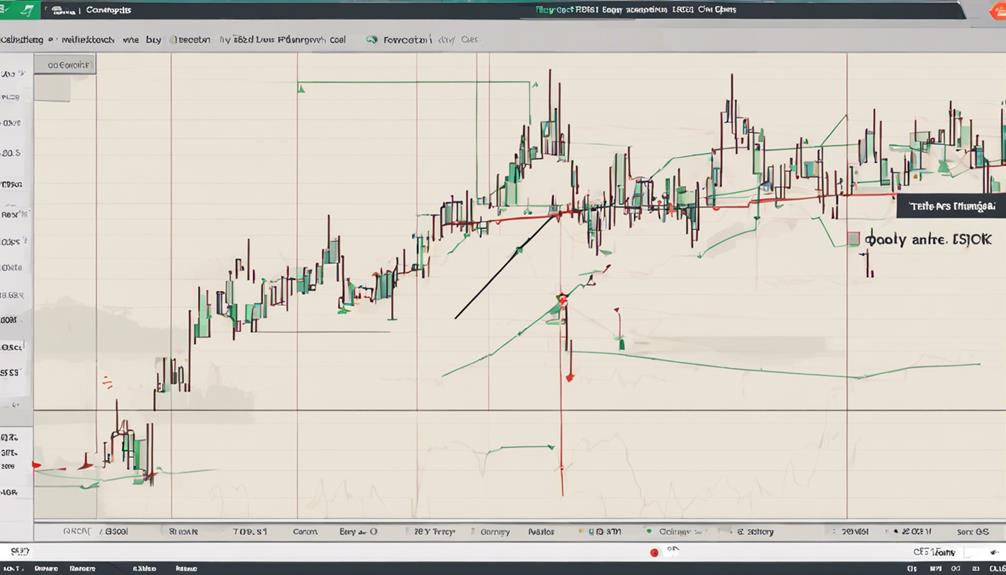
- Confirming Trend Direction: It provides signals for potential changes in trends and assists in confirming the current trend's strength.
- Combining with Other Indicators: Traders often combine ROC with other technical indicators to enhance the accuracy of their trading signals.
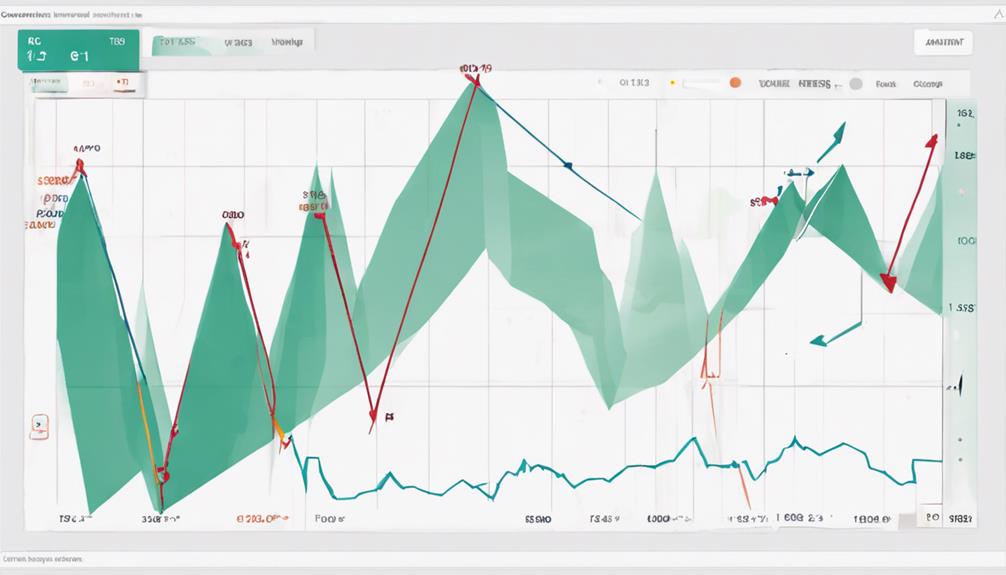
- Monitoring Momentum: ROC reaching the zero line suggests a shift in momentum, moving into negative territory signaling bearish momentum, and into positive territory indicating bullish momentum. Traders can use these signals to optimize their trading strategies and make informed decisions in the stock market.
ROC Indicator Advantages
The advantages of utilizing the Rate of Change Indicator (ROC) in stock trading are evident through its ability to pinpoint momentum shifts and identify trend reversals effectively. By measuring the percentage change in stock prices over a specific period, the ROC indicator provides traders with clear signals for entry and exit points, helping them make informed trading decisions. Moreover, the ROC indicator is versatile and applicable across various timeframes and markets, making it a valuable tool for both short-term traders and long-term investors.
One of the key benefits of using the ROC indicator is its ability to confirm the strength of trends, enabling traders to differentiate between temporary price fluctuations and significant market movements. This feature is particularly useful for identifying potential opportunities in the market and avoiding false signals. Overall, the ROC indicator serves as a reliable tool for traders looking to enhance their trading strategies and improve their overall performance in the stock market.
What are the Benefits of Using the ROC Indicator in Stock Trading?
The ROC indicator importance in trading lies in its ability to identify potential overbought or oversold conditions in the stock market. By calculating the rate of change in a stock’s price, traders can make more informed decisions and anticipate potential price reversals. This can ultimately lead to more profitable trading opportunities.
Frequently Asked Questions
What Is the Purpose of the ROC Indicator?
The purpose of the ROC indicator is to measure the speed of price changes in a stock by calculating the percentage change between the current price and the price n periods ago. It aids in identifying market momentum and potential trend reversals.
Is ROC a Good Indicator?
The ROC indicator is a valuable tool for traders seeking to assess the efficacy of momentum-based strategies. By quantifying the rate of change in stock prices, ROC helps in identifying potential opportunities for profitable trades.
How Would You Use ROC to Predict the Stock Price Movement?
To predict stock price movements using ROC, analyze the indicator's values for trend confirmations, overbought/oversold conditions, crossovers, and divergences. This data-driven approach aids in identifying potential reversal points, facilitating timely trade executions.
What Is the Most Important Indicator of a Stock?
The most crucial indicator for evaluating a stock's performance is its Price Rate of Change (ROC). This metric measures the velocity of price fluctuations over a defined period, aiding in identifying market sentiment and potential trend shifts.
Conclusion
In conclusion, the ROC indicator plays a vital role in analyzing stock market performance by measuring price changes and identifying potential trends. Its calculation method and versatility make it a valuable tool for traders seeking to optimize their trading strategies.
Incorporating the ROC indicator into technical analysis helps enhance decision-making and improve trading outcomes. Its ability to provide insights into market momentum and trend reversals makes it an essential tool for stock market participants.