
Understanding the ROC Indicator is essential for traders seeking to enhance their technical analysis skills. By exploring the five best approaches to grasp this indicator, traders can unlock valuable insights into market trends and potential trading opportunities.
From mastering the calculation method to implementing strategic trading techniques, each approach offers a unique perspective on utilizing ROC effectively. Stay tuned as we delve into the intricacies of these approaches, providing practical tips for traders looking to elevate their trading game and achieve success in the dynamic world of financial markets.
ROC Indicator Calculation Method
When calculating the ROC indicator, a key step involves subtracting the closing price n periods ago from the current closing price.
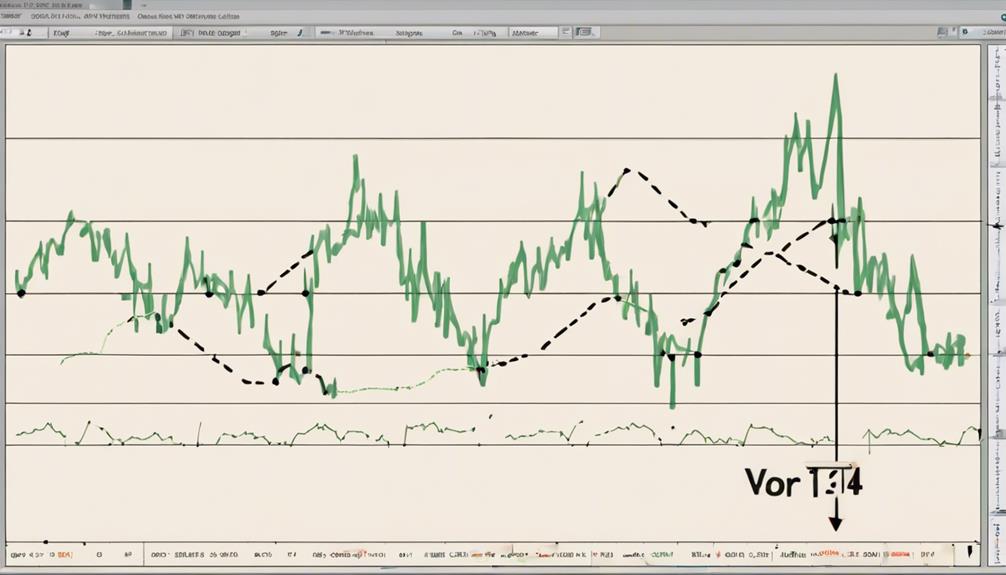
The Rate of Change (ROC) indicator is a Technical analysis tool used in trading to measure the percentage change in price between the current close and the close n periods ago. This calculation is expressed as a percentage and is commonly multiplied by 100 to provide a clearer understanding of the price movement over the specified period.
By comparing the current price to the price n periods ago, traders can gain insights into the momentum and direction of a trend.
The ROC indicator is a Moving momentum oscillator that helps traders identify potential shifts in the market sentiment. Understanding the ROC indicator calculation method aids traders in interpreting price movements and making informed decisions based on the trend analysis derived from this technical tool.
Interpreting ROC Indicator Signals
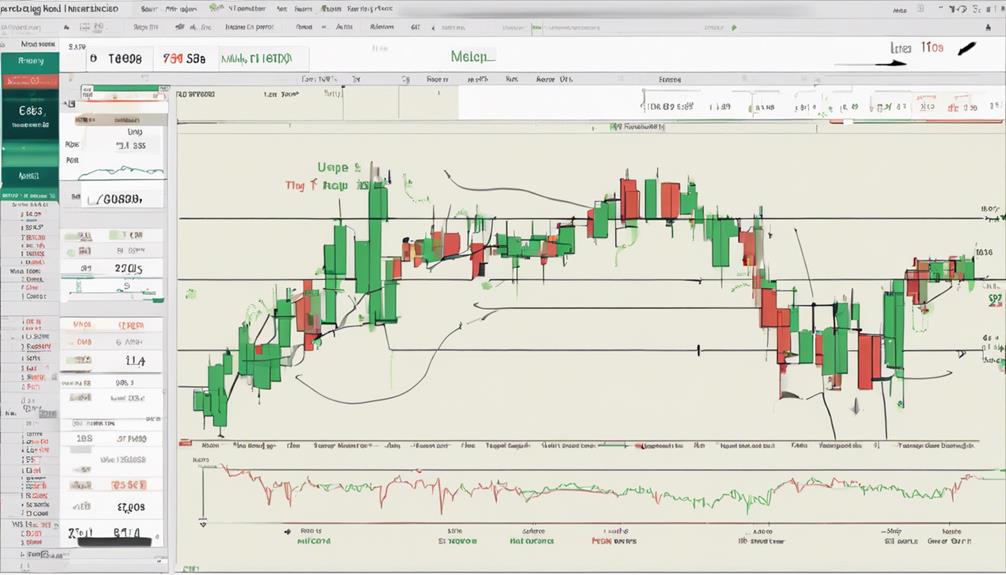
Continuing from the calculation method of the ROC indicator, interpreting ROC indicator signals involves analyzing key thresholds to determine market sentiment and potential trend movements. The Rate of Change Indicator indicates bullish sentiment when above zero and bearish sentiment when below zero. For uptrend confirmation, traders should look for the ROC crossing above zero, while a move below zero confirms a downtrend.
Divergences between price movements and ROC values can signal potential trend reversals. Extreme highs in the ROC may indicate overbought conditions, while extreme lows suggest oversold conditions. ROC crossovers with the zero line can provide insights into new trend formations, aiding in decision-making for traders.
Understanding these signals is crucial for identifying opportunities and managing risks effectively based on the bullish and bearish sentiment reflected in the ROC indicator.
Implementing ROC Indicator in Trading
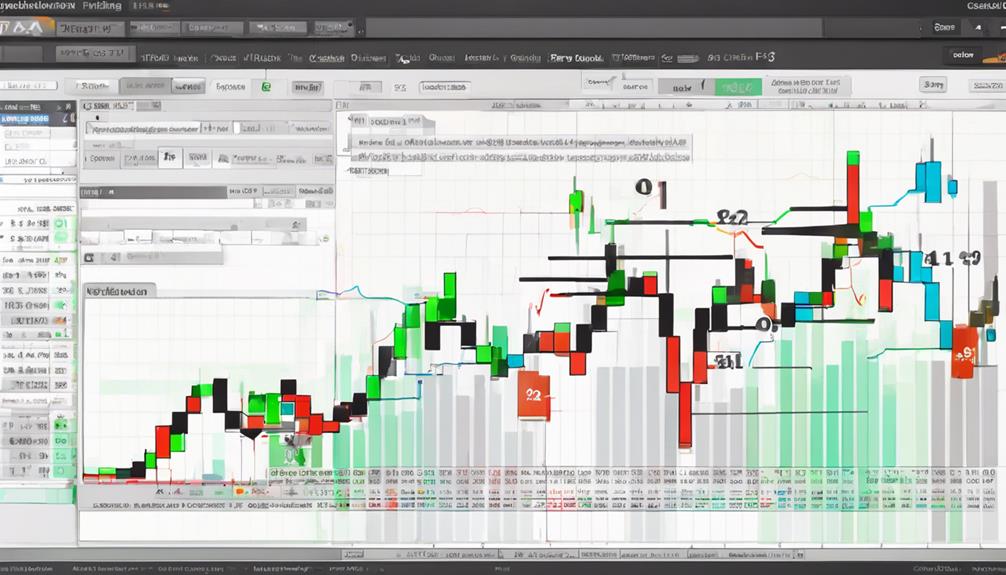
To effectively implement the ROC Indicator in trading, traders can utilize its signals to identify opportune entry and exit points in the market. Here are some key strategies to incorporate the ROC indicator effectively:
- Identifying Overbought and Oversold Zones: Use the ROC indicator to determine when an asset is overbought (above 0) or oversold (below 0), indicating potential reversal points.
- Utilizing Crossovers with the Zero Line: Pay attention to ROC crossovers with the zero line as signals for confirming changes in trend direction, providing insights into potential entry or exit points.
- Leveraging Divergences for Market Turning Points: Look for divergences between price movements and the ROC indicator to anticipate market turning points, offering valuable signals for strategic decision-making.
- Combining with Other Tools for Trade Confirmation: Enhance trade confirmation by integrating the ROC indicator with complementary technical analysis tools like moving averages or Stochastics, strengthening the validity of trading signals.
ROC Indicator Strategies for Success
Building upon the strategies outlined for effectively implementing the ROC Indicator in trading, mastering specific ROC Indicator strategies is essential for attaining success in navigating the financial markets.
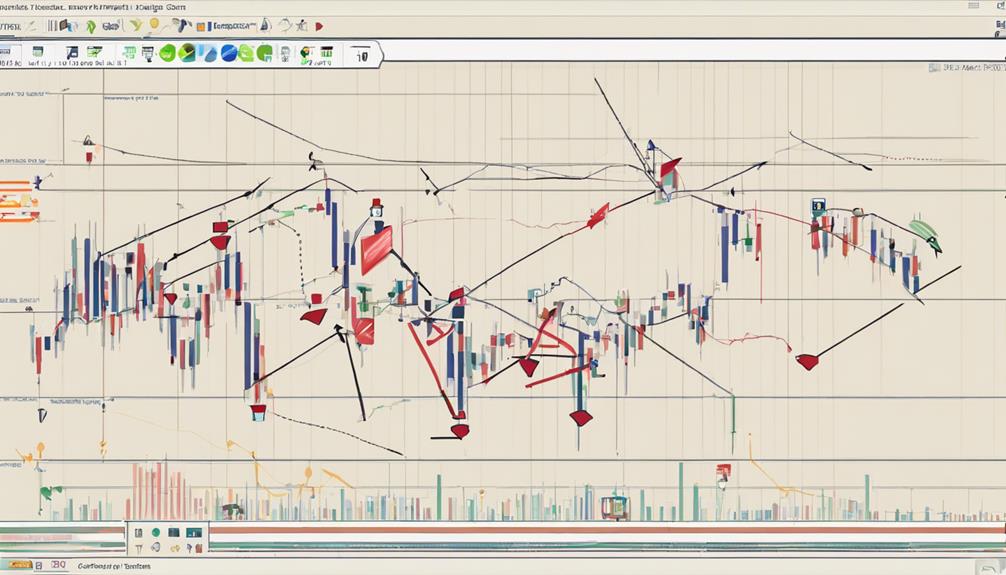
The Rate of Change (ROC) Indicator, a momentum oscillator, provides valuable insights into market dynamics. Traders can capitalize on ROC crossovers and zero line crossings to identify potential buy or sell signals. Furthermore, utilizing ROC divergences allows for precise timing of market turning points, enhancing trade entry and exit decisions.
Integrating the ROC Indicator with other technical indicators such as moving averages can further refine trading strategies and improve overall analysis. To ensure proficiency, traders should practice different ROC strategies in demo accounts to gain practical experience and fine-tune their approach.
Enhancing Trading With ROC Indicator
Incorporating the ROC Indicator into trading strategies offers a valuable tool for enhancing decision-making and maximizing trading effectiveness. When looking to enhance trading using the ROC Indicator, consider the following:
- Identifying Overbought and Oversold Zones: The ROC Indicator helps in pinpointing levels where an asset may be overbought or oversold, aiding traders in making informed decisions.
- Enhancing Trade Timing Accuracy: Utilizing ROC crossovers for buy/sell signals can improve the timing of trades, increasing the likelihood of profitable outcomes.
- Confirmation with Other Indicators: It is recommended to corroborate ROC signals with other indicators like RSI and Stochastics to validate trading decisions and minimize risks.
- Determining Entry and Exit Points: The ROC Indicator not only confirms the trend direction but also assists in identifying optimal entry and exit points, crucial for successful trading strategies.
What are the Best Approaches to Grasp the ROC Indicator?
When it comes to learning the ROC indicator, it’s essential to start by understanding its calculation and interpretation. Focus on studying different trading strategies that incorporate the ROC indicator and practice applying it in real-time market analysis. Learning from the experiences of seasoned traders can also offer valuable insights.
Frequently Asked Questions
What Is the ROC Indicator Strategy?
The ROC indicator strategy calculates the price change percentage over a defined period, aiding in identifying momentum shifts. Traders utilize it to pinpoint overbought/oversold conditions, divergence patterns, and confirm trends. ROC crossovers and zero line crossings provide crucial buy/sell signals.
Is ROC a Leading or Lagging Indicator?
ROC is recognized as a leading indicator due to its ability to forecast potential price shifts based on momentum changes. Traders leverage ROC to anticipate trend reversals ahead of price movements, enabling proactive decision-making and strategic positioning.
Is ROC a Good Indicator?
The ROC indicator proves its worth by effectively gauging the speed of price changes, identifying market extremes, and signaling reversals. Its versatility across timeframes and markets, when combined with complementary indicators, enhances its utility for traders.
Is ROC Overbought and Oversold?
The ROC indicator does not define overbought or oversold levels intrinsically. Traders observe extreme positive ROC values as potential overbought signals and significant negative values as oversold indications. Historical extremes help assess market conditions.
Conclusion
In the world of trading, the ROC Indicator acts as a compass guiding traders through the turbulent seas of the market.
By understanding its calculation method, interpreting signals, and implementing strategies effectively, traders can navigate with confidence and precision.
Just as a skilled captain relies on their compass to steer the ship towards its destination, traders can rely on the ROC Indicator to make informed decisions and achieve success in the trading world.