
The Rate of Change (ROC) indicator, a fundamental tool for traders, holds the key to unlocking valuable insights into market momentum and price trends. Understanding the intricacies of this indicator can significantly enhance one's trading decisions and strategies.
From its calculation methodology to practical applications in trading, exploring the comprehensive guide on learning the ROC indicator promises to equip traders with essential knowledge for navigating dynamic market conditions.
As we delve deeper into the nuances of the ROC indicator, uncovering its full potential in optimizing trading performance becomes an intriguing journey worth embarking on.
Calculation of the ROC Indicator
The calculation of the ROC indicator involves determining the percentage difference between the current price of a security and its Price n Periods Ago using the formula [(Current Price – Price n Periods Ago) / Price n Periods Ago] * 100. This computation provides traders with a quantitative measure of the price movement over a specified number of periods.
The ROC formula is a fundamental component of Technical Indicators and is particularly useful in analyzing the momentum of a security. Positive ROC values signify an upward price trend, indicating potential buying opportunities, while negative values suggest a downward trend, signaling potential selling opportunities.
Traders often incorporate ROC values into their trading strategy to assess the speed and direction of price movements accurately. ROC is commonly utilized alongside other Technical Indicators such as moving averages to enhance the effectiveness of analyzing price behavior.
Understanding the ROC indicator and its significance is crucial for traders seeking to make informed decisions based on price rate of change analysis.
Example Scanners Based on ROC Indicator
Scanners leveraging the ROC indicator, such as TS: Rate of Change and TS: Rate of Change 0 developed by Kevin Shah, play a pivotal role in identifying stock momentum shifts. These tools help traders identify potential trading opportunities by analyzing the Rate Of Change Indicator on a Stock Chart.
By incorporating these scanners into trading strategies, traders can effectively confirm the direction of a trend and execute trades based on the identified momentum shifts. Utilizing the ROC indicator scanners assists traders in spotting overbought and oversold conditions in stocks, enhancing their ability to make informed trading decisions.
The visual representations provided by Kevin Shah's tools offer valuable insights into price momentum, making it easier for traders to interpret and act upon ROC data. Overall, these scanners serve as essential technical analysis tools for traders looking to trade with the ROC indicator and capitalize on stock momentum changes.
Interpretation of the ROC Indicator
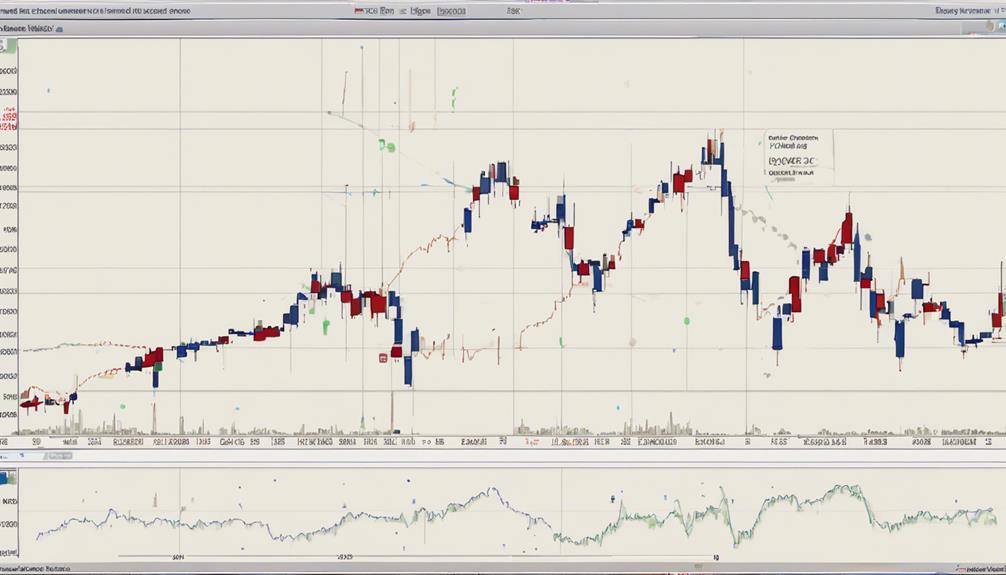
When analyzing the ROC Indicator, traders focus on interpreting price movements relative to zero to gauge potential shifts in market momentum. A ROC Indicator above zero indicates an increase in price momentum, while a ROC Indicator below zero suggests a decrease. This indicator can help traders identify overbought and oversold zones, indicating potential reversals in trend direction.
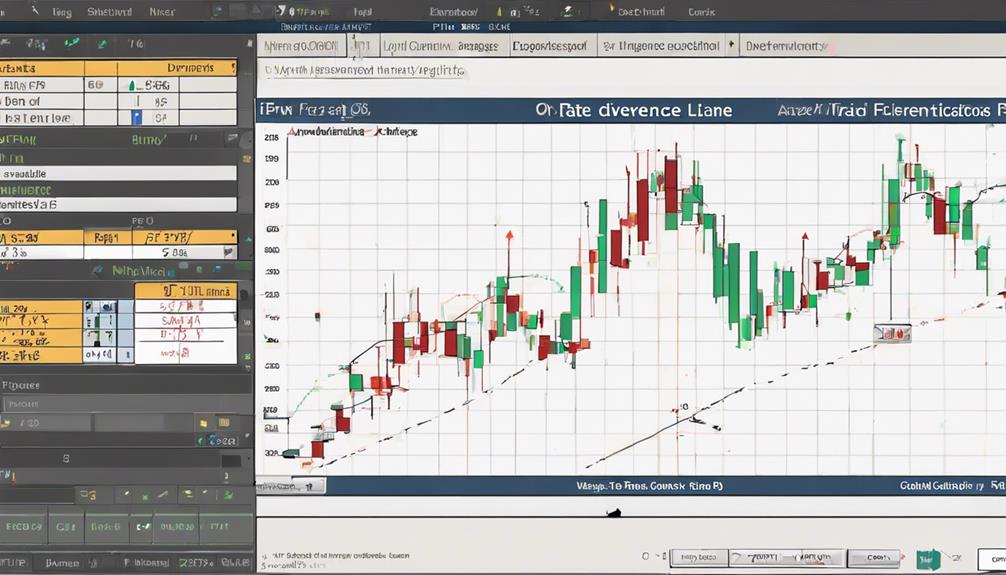
Divergence between the ROC Indicator and price action, such as bullish or bearish divergence, can signal upcoming reversals. As a leading oscillator, the ROC Indicator reacts quickly to price changes, making it a valuable tool for traders seeking insights into short to medium-term trading strategies.
Additionally, traders often compare the performance of the ROC Indicator to benchmark indices like the Dow Jones 30 to further enhance their analysis and decision-making process. By incorporating the ROC Indicator alongside other trading indicators, traders can gain a more comprehensive view of market dynamics and potential trading opportunities.
How to Use the ROC Indicator in Trading
Utilizing the ROC Indicator in trading provides traders with a valuable tool for identifying market conditions and potential trade opportunities based on momentum analysis. The Rate of Change (ROC) indicator helps traders in spotting overbought or oversold conditions in the market, which can indicate potential reversal points. It can also be used to identify divergences between price movements and the indicator's moves, signaling possible shifts in the trend direction.
ROC crossovers above or below the zero line can confirm bullish or bearish momentum, aiding traders in making buy or sell decisions. By incorporating ROC oscillator signals into their strategies, traders can achieve effective trade timing by entering or exiting positions at short-term extreme levels. Overall, the ROC Indicator serves as a valuable tool for traders to confirm trends and make informed trading decisions.
Advantages and Limitations of ROC Indicator
The ROC indicator presents traders with a practical tool for evaluating market conditions. It can be used to spot how quickly the current price is moving, providing insights into potential buying and selling opportunities. One advantage of the ROC indicator is its simplicity in calculation and versatility across various timeframes and markets, making it accessible to all types of traders. It can be used to confirm price action and provide timely reversal signals.
However, limitations of the ROC indicator include the generation of false signals in choppy markets and its tendency to lag behind actual price movements. To mitigate these drawbacks, traders are advised to use the ROC indicator in conjunction with other analysis tools for confirmation and to adapt their strategies based on prevailing market conditions, ensuring a more robust approach to ROC Trading.
What Are the Key Components of the ROC Indicator and How Can I Use It in Trading?
The comprehensive ROC indicator guide provides valuable insights into the key components of the Rate of Change (ROC) indicator. Understanding its calculation method and interpretation can help traders identify potential trends and make informed trading decisions. Utilize the guide to effectively incorporate the ROC indicator into your trading strategy.
Frequently Asked Questions
How Do You Read a ROC Indicator?
When reading a ROC indicator, observe if it's above zero for price increases or below zero for decreases. Note its support and resistance levels. Divergence from price may indicate reversals. Compare it to benchmarks for performance insights.
What Is the Difference Between ROC and RSI Indicator?
ROC (Rate of Change) measures price speed over a period for momentum analysis and trend confirmation. RSI (Relative Strength Index) gauges price strength for detecting overbought or oversold conditions and potential reversals. ROC focuses on momentum shifts; RSI on price reversals.
What Is the Difference Between MACD and Roc?
MACD and ROC differ in their functions: MACD is a trend-following indicator that gauges momentum strength via moving averages, while ROC measures the speed of price change by comparing current price to a past price.
How Would You Use ROC to Predict the Stock Price Movement?
Utilize the Rate of Change (ROC) indicator to anticipate stock price variations. Positive ROC values hint at potential uptrends, while negative values suggest possible downtrends. Monitor momentum shifts, confirm trends, and spot divergence for informed trading decisions.
Conclusion
In the intricate tapestry of trading, the ROC indicator serves as a guiding star, illuminating the path to potential opportunities and pitfalls. Like a skilled navigator, traders must heed its signals with caution and precision, utilizing its insights to navigate the turbulent waters of the market.
Just as a compass points true north, the ROC indicator can steer traders towards success, provided they interpret its signals with wisdom and foresight.