
In the realm of technical analysis, Elliott Wave Theory stands as a formidable tool for traders seeking to decipher market movements. 'Decoding Elliott Waves: An Easy Step-By-Step Process' offers a structured approach to understanding and applying this complex theory, providing a roadmap for navigating the intricacies of wave patterns.
By demystifying the rules governing impulse and corrective waves, this resource lays the foundation for a deeper comprehension of market dynamics. Through the integration of Fibonacci retracements and practical trading strategies, traders are poised to enhance their analytical skills and potentially gain a competitive edge in the ever-evolving financial markets.
Understanding Elliott Wave Basics
Elliott Wave Basics serve as the foundational principles that underpin the Elliott Wave theory, a market analysis technique developed by Ralph Nelson Elliott in the 1930s. This theory aims to identify and interpret repetitive wave patterns in financial markets to forecast market trends and cycles. Waves in this theory are categorized into two main types: Impulse waves and Corrective waves. Impulse waves move in the direction of the trend and consist of five sub-waves, while Corrective waves, which aim to counter the trend, contain three sub-waves.
Understanding these wave patterns and their significance in market movements is crucial for traders looking to develop effective trading strategies based on Elliott Wave theory. By analyzing the patterns of price movements, traders can gain insights into potential market trends and make informed decisions. Elliott Wave theory provides a structured approach to interpreting market dynamics, offering a systematic way to navigate the complexities of financial markets.
Identifying Impulsive Vs. Corrective Waves
Building on the foundational understanding of Elliott Wave patterns, discerning between Impulsive and Corrective Waves is essential for traders seeking to navigate market trends effectively and make informed trading decisions.
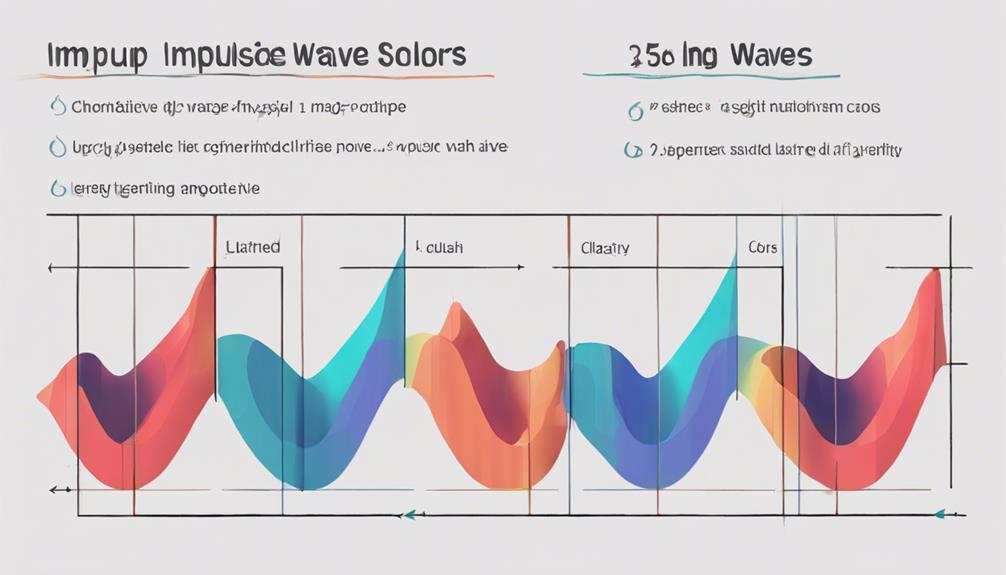
Impulsive waves, characterized by five sub-waves moving in the trend direction, signify robust market momentum. These waves, following Elliott Wave rules, particularly maintain wave three as the longest, aiding traders in identifying potential entry and exit points.
On the other hand, Corrective waves, such as diagonal patterns with three sub-waves, act as temporary corrections within the larger trend. They can manifest as expanding or contracting wedges with five sub-waves, influencing the overall market direction.
Deciphering Elliott Wave Patterns
Understanding the intricate patterns within Elliott Waves is crucial for traders looking to interpret market movements with precision and make strategic trading decisions. Elliott Wave Patterns consist of impulse waves, which move with the trend in 5 sub-waves, and corrective waves, which move against the trend in 3 sub-waves.
The pattern alternates between bullish and bearish cycles, providing valuable insights into market cycles and trend analysis. By deciphering these patterns, traders can enhance their market forecasting abilities. Recognizing the wave structure allows for a deeper understanding of how markets behave, aiding in predicting potential future price movements.
This knowledge is fundamental for traders seeking to capitalize on market opportunities and manage risks effectively. In essence, mastering Elliott Wave Patterns empowers traders with a comprehensive framework for analyzing market trends and making informed trading decisions.
Implementing Fibonacci With Elliott Waves
Analyzing market trends through the integration of Fibonacci retracement levels with Elliott Waves provides traders with a strategic approach to identifying potential reversal points and confirming trade setups.
When conducting Elliott Wave Trading, Fibonacci Retracement levels play a crucial role in determining potential reversal zones within the market structure. These Fibonacci levels, such as 38.2% and 50%, often act as significant areas of support or resistance in conjunction with Elliott Waves, aiding traders in pinpointing key turning points.
By seeking confluence between Fibonacci levels and Elliott Wave patterns, traders can enhance the accuracy of their analysis and increase confidence in their trade setups.
Additionally, Fibonacci retracement tools assist in forecasting the likely retracement levels of corrective waves within the Elliott Wave sequence. This integration of Fibonacci ratios with Elliott Waves not only adds precision to market analysis but also provides a systematic method for identifying potential reversal points and optimizing trade entries.
Trading Strategies Using Elliott Waves

Utilizing Elliott Waves in trading strategies offers a structured framework for identifying potential entry and exit points based on specific wave patterns. Traders analyze wave patterns within the context of Elliott Wave Theory to make informed decisions.
Corrective waves present opportunities for profit-taking and effective risk management by allowing traders to capitalize on temporary price reversals. On the other hand, impulse waves indicate potential trend continuation opportunities where traders can ride the momentum for further gains.
Can I Use the Three Key Steps to Interpret Elliott Wave Counts in Your Decoding Elliott Waves Guide?
Yes, you can use the three key steps to interpret Elliott Wave counts in the Decoding Elliott Waves Guide. This comprehensive guide provides valuable insights into understanding and interpreting Elliott Wave counts, helping traders make informed decisions in the market. Mastering these steps can greatly enhance your ability to interpret Elliott Wave counts accurately.
Frequently Asked Questions
What Are Elliott's Waves Simplified?
Elliott Waves, a technical analysis tool, simplify market trend forecasting. They consist of impulse waves moving with trends and corrective waves against them. Impulse waves have five sub-waves, while corrective ones have three, following a pattern of bullish and bearish cycles.
How Do You Trade Elliott Wave for Beginners?
For beginners trading Elliott Wave, start by identifying wave patterns, differentiating between impulse and corrective waves. Using technical indicators can enhance accuracy. Analyze long-term charts for insights into market dynamics, then apply patterns in trading strategies for informed decisions.
How Do You Start Counting Elliott Waves?
Initiate Elliott Wave counting from significant price swings. Commence higher-degree cycles from weekly or monthly charts for a comprehensive view. Start wave count from the previous impulsive wave's end for consistency. Apply technical tools for precision and confirm with indicators for accuracy.
How Do You Draw Elliott Wave Step by Step?
Drawing Elliott Waves step by step involves identifying a trend's beginning, counting five waves in the trend, labeling waves based on Elliott Wave theory, and using tools like Fibonacci retracement for validation. Practice on various timeframes enhances pattern recognition for trading decisions.
Conclusion
In conclusion, mastering Elliott Wave Theory is akin to unraveling the intricate patterns of a complex puzzle. By understanding the basics, distinguishing between impulse and corrective waves, decoding wave patterns, and integrating Fibonacci retracements, traders can navigate the market with precision and confidence.
The systematic approach outlined in this resource equips traders with the tools needed to unlock the potential of Elliott Waves and make strategic trading decisions.