
In the world of technical analysis, mastering the interpretation of Elliott Wave counts requires a structured approach. By focusing on key steps such as identifying wave patterns, understanding wave degrees, and applying the theory to market analysis, traders can gain valuable insights into market dynamics.
However, the intricacies of Elliott Wave Theory go beyond surface-level understanding and demand a deeper exploration into the complexities of wave interactions and market behavior. By unraveling the nuances of these three fundamental steps, traders can potentially enhance their ability to navigate the complexities of financial markets with greater precision and confidence.
Understanding Elliott Wave Theory Counts
Understanding Elliott Wave Theory counts is foundational for successfully interpreting market movements. Elliott Wave Theory involves identifying wave patterns, consisting of impulse waves and corrective waves, within the market. These waves follow specific rules and guidelines to ensure accurate analysis. Furthermore, understanding wave degrees, ranging from Grand Supercycle to Subminuette, is crucial for interpreting wave counts effectively.
By correctly interpreting wave counts, analysts can make more informed predictions about future market movements.
Properly applying Elliott Wave Theory counts enables traders and investors to anticipate potential shifts in the market with greater precision. By recognizing the various wave patterns and understanding their significance, individuals can develop a more comprehensive view of market dynamics. This knowledge empowers them to make strategic decisions based on a deeper understanding of market behavior.
In essence, mastering the art of interpreting Elliott Wave Theory counts is a valuable skill that can enhance one's ability to navigate the complexities of financial markets.
Identifying Wave Patterns
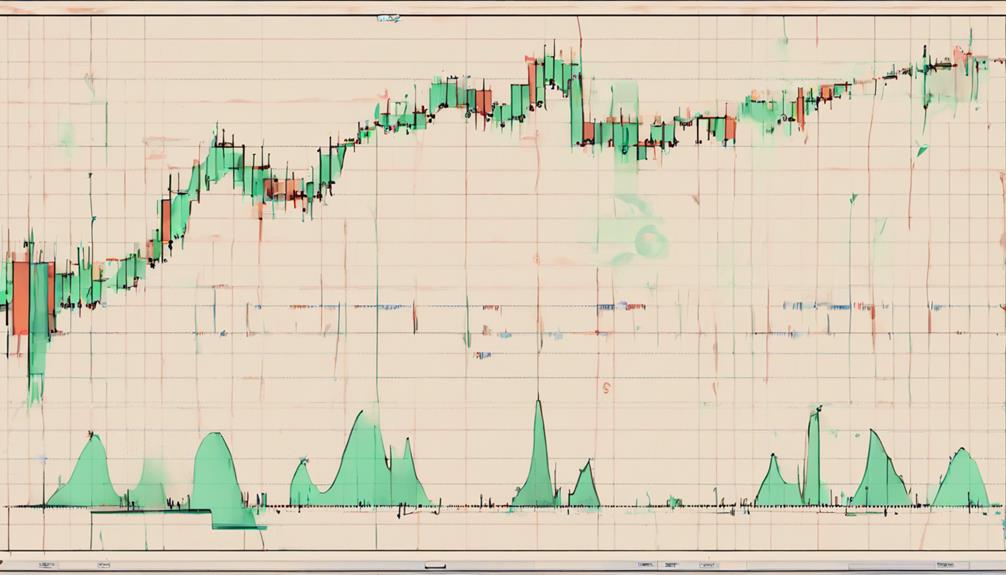
In the analysis of market movements through Elliott Wave Theory, the identification of distinct wave patterns plays a fundamental role in guiding traders and investors. When it comes to identifying wave patterns, traders need to focus on specific aspects to make accurate interpretations and informed trading decisions.
- Wave Patterns: Elliott Wave Theory categorizes market movements into impulse waves (1, 2, 3, 4, 5) and corrective waves (A, B, C).
- Wave Counting: Traders analyze the size, duration, and structure of waves to correctly count and label them within the Elliott Wave framework.
- Structure of Waves: Understanding the internal structure of each wave is essential for accurate wave interpretation and pattern recognition.
- Guidelines for Wave Counting: Traders must adhere to specific rules and guidelines outlined in Elliott Wave Theory to ensure consistency in wave counting and pattern analysis.
Analyzing Wave Degrees
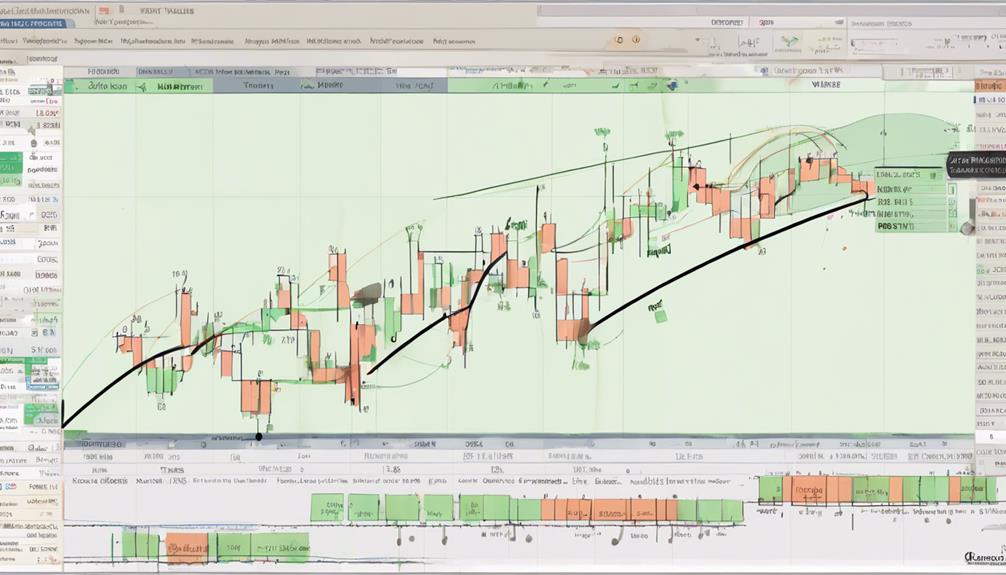
Analyzing wave degrees in Elliott Wave Theory provides crucial insights into market trends and potential reversals, aiding traders in making informed decisions. By identifying the various degrees of waves, traders can pinpoint where the market stands in terms of progress and anticipate potential trend reversals. Each wave degree signifies a specific cycle within the Elliott Wave Theory framework, offering valuable information on the magnitude of market movements. Understanding wave degrees is vital for assessing the strength of trends and corrections, enabling traders to gauge the overall market dynamics accurately.
Moreover, wave degrees play a significant role in wave counting and interpreting patterns within the market analysis. Traders rely on wave degrees to differentiate between various stages of market trends and corrections, which helps them make sound trading decisions. Therefore, a comprehensive grasp of wave degrees is essential for traders looking to navigate the complexities of the market effectively and capitalize on profitable opportunities.
Applying Fibonacci Ratios
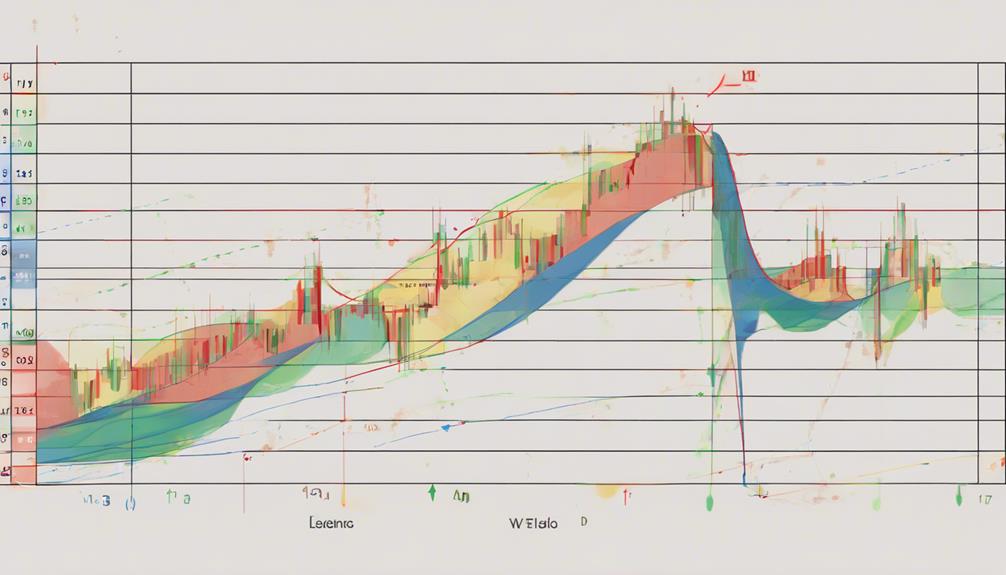
Wave degrees in Elliott Wave Theory provide a foundational framework for applying Fibonacci ratios in market analysis. When it comes to Elliott Wave analysis, Fibonacci ratios play a crucial role in determining potential support and resistance levels, as well as projecting price corrections and extensions. Here are four key ways in which Fibonacci ratios are applied in Elliott Wave analysis:
- Retracements: Fibonacci retracement levels such as 38.2%, 50%, and 61.8% are essential in identifying areas where price corrections align with Elliott Wave counts.
- Extensions: Traders use Fibonacci extensions to forecast potential price targets for the upcoming wave within an Elliott Wave sequence.
- Support and Resistance Levels: Fibonacci ratios help in pinpointing levels where assets may encounter significant support or resistance based on historical price movements.
- Setting Profit Targets and Stop-Loss Levels: By utilizing Fibonacci ratios, traders can establish systematic approaches for determining profit targets and stop-loss levels in alignment with Elliott Wave counts.
Making Trading Decisions
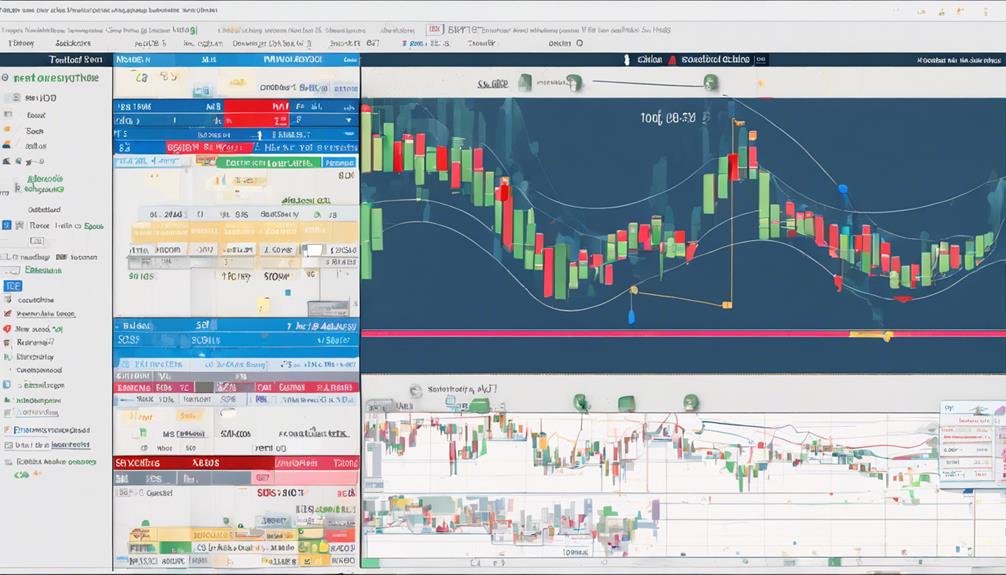
Utilizing Elliott Wave counts can significantly aid traders in making informed and strategic trading decisions within financial markets. By analyzing wave counts, traders can pinpoint potential entry and exit points, allowing them to capitalize on market trends with greater precision. Understanding Elliott Wave interpretation provides valuable insights into the direction and strength of price movements, enabling traders to gauge the probability of market changes accurately.
Making trading decisions based on Elliott Wave counts enhances traders' ability to anticipate market shifts and react promptly to evolving conditions. The accuracy of these decisions is bolstered by correctly interpreting wave counts, leading to more effective trading strategies. By integrating Elliott Wave analysis into their decision-making process, traders can navigate the complexities of financial markets with increased confidence and agility. Ultimately, the systematic approach offered by Elliott Wave theory empowers traders to make well-informed decisions that align with their trading objectives and risk tolerance levels.
How Can the Elliott Wave Theory Help in Identifying False Signals in CMF Indicator Analysis?
The Elliott Wave Theory plays a crucial role in circumventing false signals analysis when using the CMF indicator. By identifying wave patterns, traders can determine the strength of market trends and avoid potential misinterpretations of the CMF indicator, ultimately leading to more accurate and informed trading decisions.
Frequently Asked Questions
What Are the 3 Rules of Elliott Wave?
The three fundamental rules of Elliott Wave Theory are pivotal for accurate wave count analysis. Rule 1 mandates that Wave 2 should not exceed 100% of Wave 1. Rule 2 dictates that Wave 3 must be longer than Waves 1 and 5 in an impulse wave. Rule 3 stipulates that Wave 4 should not overlap with Wave 1.
What Are the Three Technical Indicators to Help You Ride the Elliott Wave Trend?
To ride the Elliott Wave trend successfully, traders should utilize Moving Average Convergence Divergence (MACD) for momentum signals, Relative Strength Index (RSI) for identifying overbought/oversold conditions, and Fibonacci Retracement levels for pinpointing potential reversal points.
What Is the Elliott Wave Counting Method?
The Elliott Wave counting method is a technical analysis tool used in financial markets to identify and label waves. This method helps traders analyze trends and predict price movements by understanding market psychology and patterns in price action.
What Are the Three Fundamental Corrective Wave Patterns in Elliott Wave?
The three fundamental corrective wave patterns in Elliott Wave Theory are Zigzag, Flat, and Triangle. Zigzag waves move sharply against the trend, Flats exhibit sideways movement, and Triangles consolidate price within converging trendlines. Understanding these patterns is crucial for accurate wave counting and market analysis.
Conclusion
In the intricate tapestry of market analysis, the three key steps to interpret Elliott Wave counts act as guiding stars, illuminating the path to understanding market trends.
Like skilled navigators, traders must recognize the patterns, degrees, and Fibonacci ratios to navigate the turbulent waters of financial markets.
By mastering these steps, traders can unlock the secrets hidden within the waves, leading them towards profitable trading decisions and success in the vast ocean of trading.