
Just like a compass guides you through uncharted waters, the Aroon Indicator can steer you towards profitable trading decisions. With its unique ability to gauge trend strength and potential reversals, this technical tool holds a wealth of insights waiting to be uncovered.
From understanding its calculations to exploring advanced strategies, each aspect of the Aroon Indicator offers a key to unlocking the mysteries of market movements.
So, why not discover the top 10 insights into Aroon Indicator technical analysis and gain a deeper understanding of how this powerful tool can elevate your trading game?
Aroon Indicator Overview
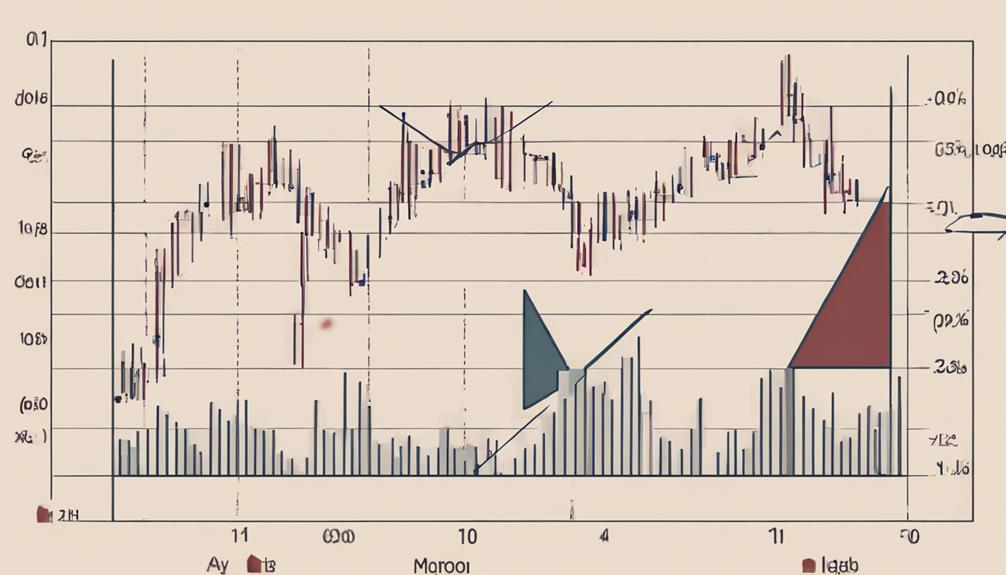
The Aroon Indicator, developed by Tushar Chande in 1995, serves as a valuable tool for traders seeking to gauge trend strength and anticipate potential reversals.
This technical indicator consists of two lines, Aroon Up and Aroon Down, which help identify up-trends and down-trends. Aroon Up measures the strength of the uptrend, while Aroon Down measures the strength of the downtrend.
By analyzing these lines, traders can determine the duration and strength of a trend, enabling them to make informed trading decisions.
Understanding the Aroon Indicator can assist in recognizing strong trends, pinpointing potential trend reversals, and identifying areas of support and resistance.
Incorporating the Aroon Indicator into your trading strategies can enhance your ability to determine optimal entry and exit points.
Understanding Aroon Indicator Calculation
Understanding the calculation process for the Aroon Indicator involves determining the periods elapsed since the highest and lowest prices.
The Aroon Up formula computes the percentage of periods that have passed since the highest price, while the Aroon Down formula calculates the percentage of periods since the lowest price.
These formulas, [(Number of periods) – (Number of periods since the High)] / (Number of periods) * 100% for Aroon Up, and [(Number of periods) – (Number of periods since the Low)] / (Number of periods) * 100% for Aroon Down, provide insight into the strength and direction of a trend.
The default period setting for the Aroon Indicator is 14, which is commonly used for short-term trend analysis, but can be adjusted to longer periods like 25-30 for more extensive trend evaluation.
Interpreting Aroon Indicator Signals
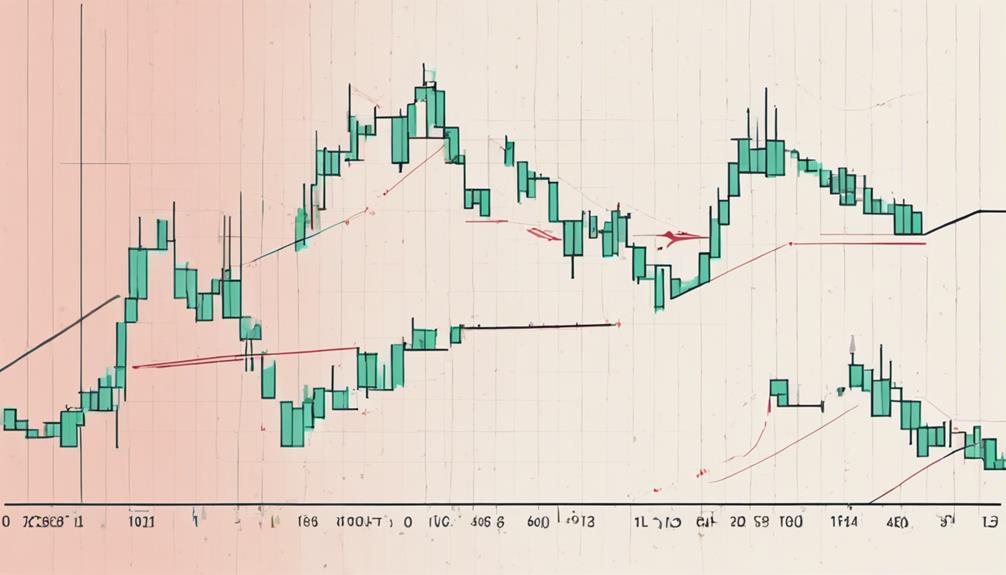
Analyzing Aroon Indicator Signals offers traders valuable insights into potential price movements and trend strength. When interpreting these indicator signals, keep an eye out for key patterns:
- Aroon-Up crossing above Aroon-Down suggests an uptrend, indicating potential price movement in that direction.
- Conversely, Aroon-Down crossing above Aroon-Up signals a downtrend, implying downward price action.
- If both Aroon-Up and Aroon-Down are above 50, it signifies a strong trend, while readings below 50 may indicate periods of consolidation.
Aroon Indicator Strategies Revealed
When considering Aroon Indicator strategies, it is essential to focus on trend identification techniques and timing entry/exit points. By utilizing breakout trading and trend strength analysis, you can make informed decisions based on Aroon Indicator signals.
Comparing the Aroon Indicator with the ADX indicator can enhance trend analysis capabilities.
Trend Identification Techniques
Utilize the Aroon Indicator to effectively identify trends in the market and make informed trading decisions based on Aroon-Up and Aroon-Down line movements. The Aroon Indicator provides crucial insights into trend direction and strength, offering traders valuable entry and exit signals through line crossovers. By interpreting Aroon-Up line crosses over Aroon-Down line as bullish trends and vice versa for bearish trends, you can pinpoint optimal trading points. This technique allows for the identification of trend reversals and assessment of trend intensity accurately. Employing Aroon Indicator strategies can enhance your ability to make well-informed trading decisions and increase profitability significantly.
- Aroon Indicator aids in identifying trend direction and strength.
- Aroon-Up crossing above Aroon-Down signifies a bullish trend, while the reverse indicates bearish sentiment.
- Entry and exit signals are generated based on line crossovers, optimizing trading decisions.
Timing Entry and Exits
To effectively time your trades using Aroon Indicator strategies, focus on identifying key entry and exit signals generated by Aroon line crossovers. When the Aroon Up line crosses above the Aroon Down line, it indicates a potential uptrend entry point, suggesting a favorable time to enter a trade.
Conversely, for exits, watch for the Aroon Down line crossing above the Aroon Up line, signaling a potential downtrend exit point. Utilizing Aroon crossovers can provide precise entry and exit signals, aiding in timing trades effectively.
Aroon Indicator Vs. Other Technical Indicators
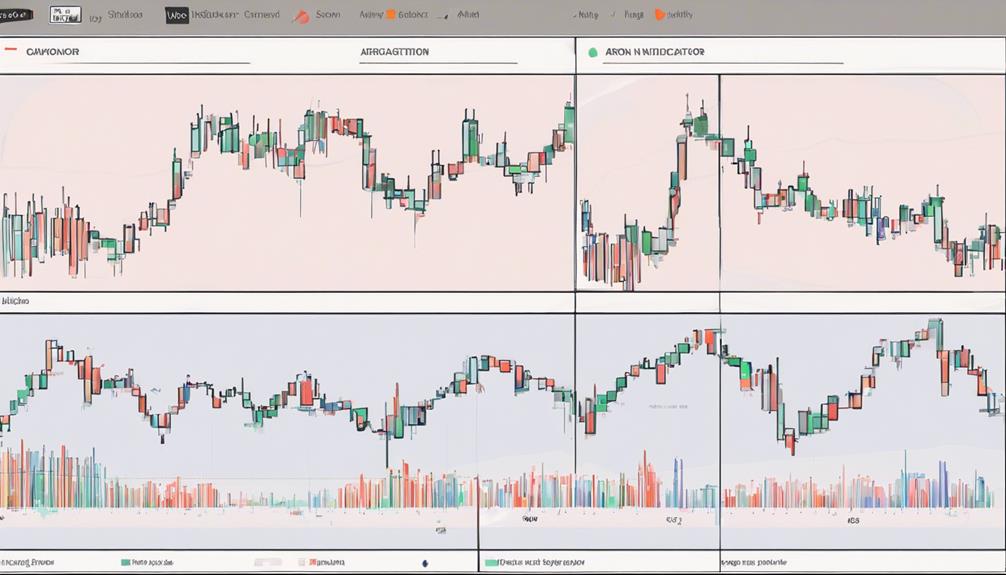
In comparison to other technical indicators, the Aroon Indicator stands out for its unique ability to measure trend strength and identify potential reversals in the market. This distinction arises from its setup of two lines for up-trends and down-trends, offering a clear visual representation.
The Aroon Indicator also excels in providing insights into trend duration, helping traders gauge the longevity of a trend. Moreover, its capability to assist in momentum identification sets it apart from traditional technical indicators.
These characteristics give traders using the Aroon Indicator a strategic advantage in understanding market trends and potential reversals better than with many other indicators.
Aroon Indicator Trading Tips
When utilizing the Aroon Indicator, focus on interpreting entry and exit signals for potential trade opportunities.
Implement risk management strategies to safeguard against unexpected market movements.
These trading tips are crucial for maximizing the effectiveness of the Aroon Indicator in your trading decisions.
Entry and Exit Signals
When Aroon Up crosses above Aroon Down, it signals a potential bullish entry point in technical analysis. This crossover suggests a strengthening uptrend and may present an opportunity to enter a long position.
Conversely, if Aroon Down crosses above Aroon Up, it indicates a possible bearish entry point, signaling a potential downtrend. Utilizing Aroon indicator crossovers can help traders identify optimal exit points, enabling them to maximize profits and minimize losses.
These signals offer clear indications for entering or exiting positions, assisting traders in capitalizing on trend reversals and momentum shifts efficiently. By paying attention to Aroon crossovers, traders can make informed decisions and enhance their overall trading strategies.
Risk Management Strategies
Implementing effective risk management strategies is essential when incorporating Aroon Indicator trading tips into your investment approach. Setting stop-loss orders is vital to protect against potential losses.
Diversification of trades helps spread risk across different assets when using the Aroon Indicator. Adjusting position sizes based on market volatility can enhance risk management.
Monitoring market conditions and adhering to risk management principles aid in better decision-making with Aroon Indicator signals. A disciplined approach to risk management is crucial for navigating market uncertainties effectively.
Advantages and Disadvantages of Aroon Indicator
The Aroon Indicator boasts a reputation for accurately delineating market trends while maintaining signal reliability by not repainting. When considering the advantages and disadvantages of the Aroon Indicator, you should note the following:
- Advantages:
- Provides reliable signals for both short-term and long-term trend analysis.
- Offers the potential for enhancing trading strategies when combined with other indicators.
- The Aroon Oscillator can be particularly effective in summarizing trend analysis for traders.
- Disadvantages:
- May generate fewer signals compared to some other indicators.
- Could potentially lag in identifying trend changes in highly volatile markets.
- Requires additional confirmation from other tools to avoid false signals.
Combining Aroon Indicator With Other Tools
When combining the Aroon Indicator with other tools, you can benefit from synergies that enhance your technical analysis.
Understanding how to integrate the Aroon Indicator with tools like MACD, Bollinger Bands, RSI, Fibonacci retracement levels, and volume indicators can provide valuable insights into market trends.
Tool Synergy Benefits
To enhance your technical analysis accuracy and confirmation of trends, consider combining the Aroon Indicator with complementary tools like Moving Averages. By integrating the Aroon Indicator with other indicators and tools, you can benefit from a more comprehensive analysis that takes into account different aspects of the market.
Here are some ways in which combining the Aroon Indicator with other tools can amplify your trading strategy:
- Utilizing Fibonacci Retracement levels alongside the Aroon Indicator can provide additional support and resistance levels for more informed decision-making.
- Pairing the Aroon Indicator with the Relative Strength Index (RSI) offers a holistic view of trend strength and momentum, enhancing the quality of trading signals.
- Integrating the Aroon Indicator with the MACD indicator helps in identifying potential trend reversals and determining entry or exit points more confidently.
Integration Strategies Explained
Enhancing your technical analysis capabilities involves synergizing the Aroon Indicator with complementary tools to optimize trend analysis and trading decisions.
By combining Aroon with moving averages, you can confirm trends and reduce false signals. Integrating RSI with Aroon offers additional validation for strategic entry and exit points.
Pairing Aroon with MACD provides a comprehensive view of trend strength and momentum, aiding in decision-making processes. Utilizing Bollinger Bands alongside Aroon helps identify potential trend reversals and volatility spikes, enabling proactive trading actions.
Incorporating Aroon with Fibonacci retracement levels assists in pinpointing crucial support and resistance levels within a trend, facilitating well-rounded trading setups.
Aroon Indicator Accuracy Assessment
Assessing the accuracy of the Aroon Indicator involves analyzing the crossovers of its Up and Down lines to evaluate the strength of identified trends. To determine the effectiveness of the indicator, consider the following:
- Strength of Trends: Evaluate the duration and intensity of trends identified by the Aroon Indicator to gauge its accuracy in predicting trend changes.
- Historical Data Analysis: Utilize historical data to assess how well the Aroon Indicator has performed in signaling trend shifts accurately over time.
- Comparison with Price Movements: Validate the accuracy of the Aroon Indicator's trend predictions by comparing its signals with actual price movements for confirmation of trend validity.
Real-World Application of Aroon Indicator
Traders often rely on the Aroon Indicator in real-world scenarios to pinpoint potential trend reversals and assess trend strength in the market. By analyzing the Aroon Up and Aroon Down lines, traders can identify strong uptrends and downtrends, helping them make informed decisions.
Aroon Indicator crossovers are particularly valuable as they indicate potential entry and exit points for trades. When the Aroon Up line crosses above the Aroon Down line, it suggests a strengthening uptrend, signaling a buying opportunity. Conversely, when the Aroon Down line crosses above the Aroon Up line, it indicates a potential downtrend, prompting traders to consider selling positions.
This practical application of the Aroon Indicator aids traders in navigating market trends effectively.
How Can I Apply the Aroon Indicator in Technical Analysis to Gain Insights?
When applying technical analysis, one of the best ways to use the Aroon indicator is to look for opportunities to identify when a new trend is forming. By paying attention to the Aroon Up and Aroon Down lines, traders can gain insights into the strength and direction of a trend, helping them make informed decisions.
Frequently Asked Questions
What Is the Best Strategy for Aroon?
To ace Aroon, aim for crossovers where Aroon-Up beats Aroon-Down (bullish) or vice versa (bearish). These signals guide your entries and exits. Test their profitability for smarter trades.
How Do You Interpret the Aroon Oscillator?
To interpret the Aroon Oscillator, first identify its position relative to the centerline. Positive values indicate bullish trends, while negative values suggest bearish trends. Focus on crossovers at the centerline for potential trend changes.
What Is the Success Rate of the Aroon Indicator?
The success rate of the Aroon indicator varies based on settings and timeframes. It is crucial to test and optimize configurations for effectiveness. Aroon shows a 47% win rate on 5-minute OHLC charts, but underperforms on other timeframes.
Is Aroon a Leading Indicator?
Yes, Aroon is a leading indicator. By identifying trend strength and reversals ahead of time, it allows you to anticipate market shifts. For instance, when Aroon Up crosses above Aroon Down, it signals a potential uptrend.
Conclusion
In conclusion, the Aroon Indicator stands out as a powerful tool for traders seeking to identify trends and make informed decisions in the market. With its customizable settings and ability to provide clear signals, the Aroon Indicator can be a game-changer in your trading strategy.
By combining it with other technical tools, you can enhance your analysis and stay ahead of the curve. Embrace the Aroon Indicator and watch your trading prowess soar to new heights!