
As you set sail into the vast sea of technical analysis, think of the Aroon Indicator as your guiding star, illuminating the murky waters of market trends. By mastering the 7 best ways to utilize this tool, you'll uncover hidden treasures of insight that can steer your trading decisions towards success.
Each method offers a unique perspective on how to harness the power of the Aroon Indicator, but the true magic lies in the synergy of applying them together. Discover how this compass can navigate you through the complexities of the market landscape, leading you to profitable shores.
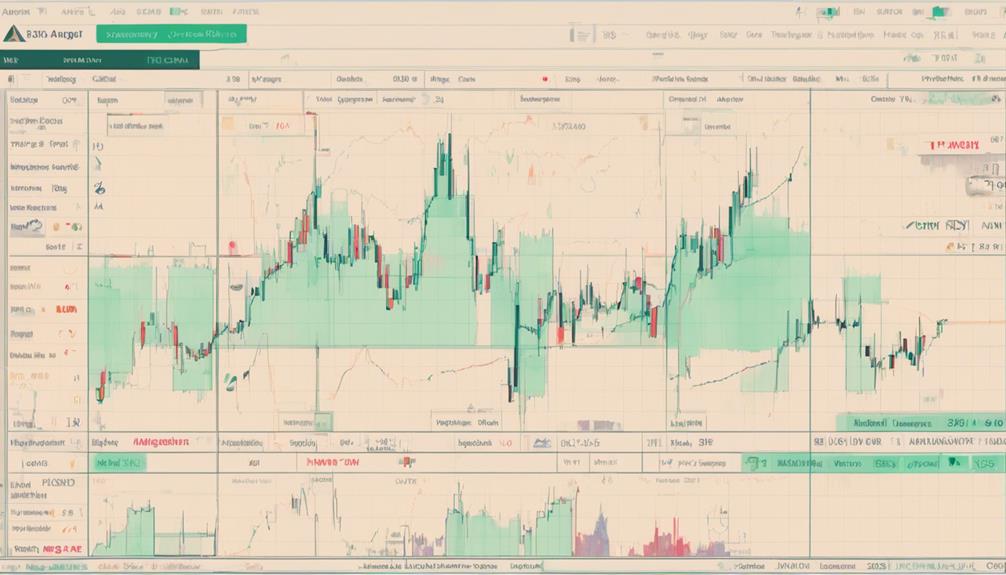
Trend Identification
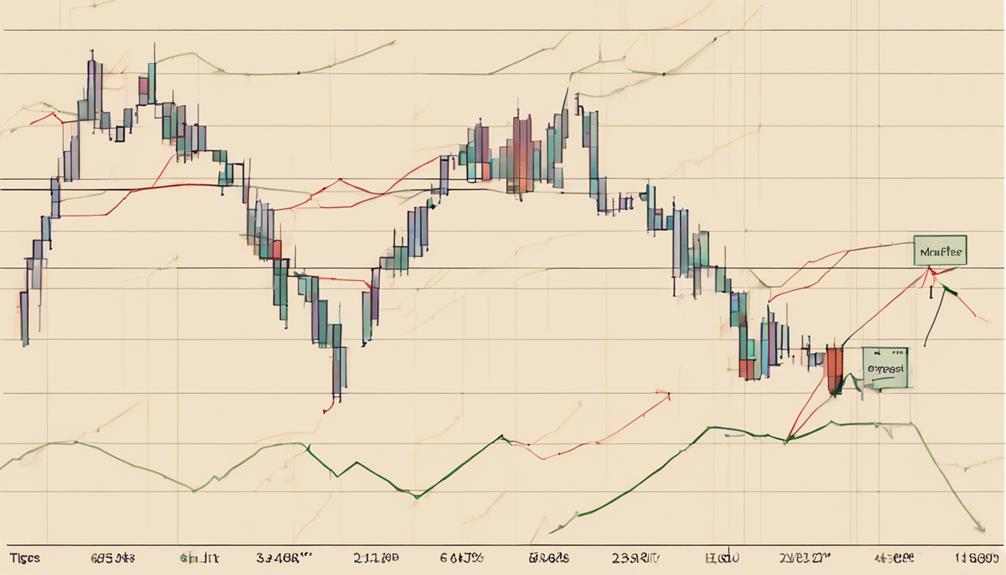
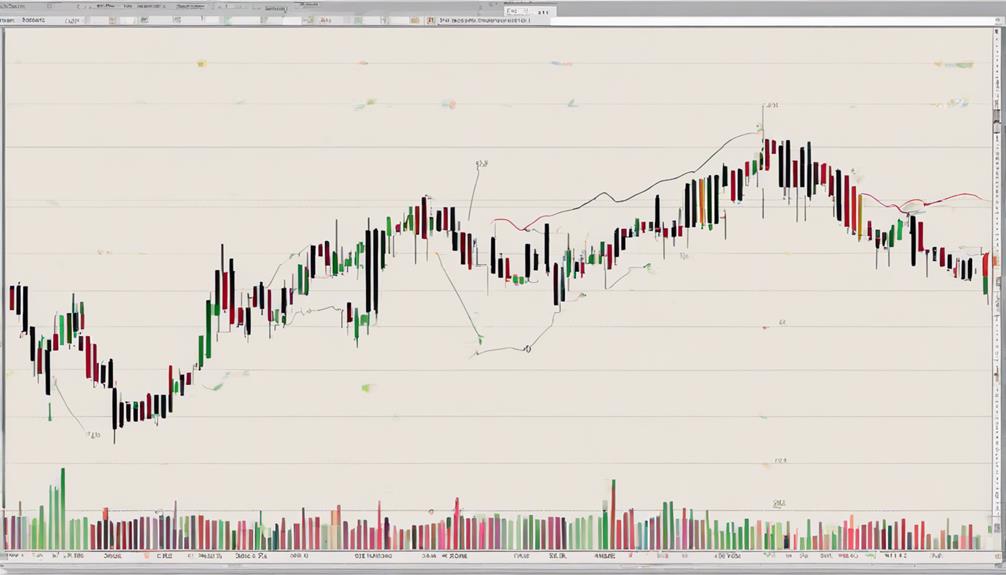
To effectively utilize the Aroon Indicator in technical analysis, understanding trend identification is essential. The Aroon Indicator helps determine trend direction by measuring the time since the last high or low. Aroon-Up indicates the time since the highest price, while Aroon-Down shows the time since the lowest price.
Through Aroon crossovers, which provide signals for trend changes, traders can better grasp the market direction. High Aroon values imply robust trends, while low values suggest weaker trends. By analyzing these aspects, you can make informed decisions when interpreting the Aroon Indicator within technical analysis.
Recognizing and interpreting these trend signals is crucial for successful trading strategies and risk management.
Consolidation Patterns
When Aroon-Up and Aroon-Down lines both fall below 50, it signals a period of consolidation where price range tightens. Recognizing these patterns with the Aroon Indicator helps you navigate through phases of limited price movement and undefined trends.
Utilizing this knowledge can aid in avoiding false breakouts and pinpointing optimal entry points in your trading strategy.
Charting Consolidation Trends
Chart consolidation trends are easily identified using the Aroon Indicator when both Aroon-Up and Aroon-Down readings remain below 50. During these periods, the market is likely in a consolidation phase with flat prices or trading ranges, indicating indecision among traders.
To navigate this scenario effectively, traders should pay attention to specific signals to avoid false breakouts or breakdowns. Recognizing consolidation patterns is vital as it can enhance decision-making processes in ranging markets.
Here are key points when charting consolidation trends using the Aroon Indicator:
- Aroon-Up and Aroon-Down readings below 50 signal flat prices or trading ranges.
- Aroon-Up crossing below Aroon-Down below 50 suggests a possible consolidation phase.
- Identifying consolidation trends helps in avoiding false breakouts or breakdowns.
- Aroon Indicator's role in detecting consolidation patterns improves decision-making in ranging markets.
Interpreting Price Ranges
During periods of price consolidation, interpreting price ranges is crucial for making informed trading decisions based on Aroon indicator readings below 50.
When Aroon values are below this threshold, it signals a lack of significant trend movements and indicates flat prices. Recognizing price consolidation through Aroon readings helps traders identify periods of price stability and sideways movement.
Understanding these patterns allows for better navigation of the market during times of price ranges. By interpreting price ranges accurately, traders can adjust their strategies to align with the lack of trends and anticipate potential breakout points.
Utilizing the Aroon indicator in such scenarios enhances decision-making by providing insights into the market dynamics and guiding actions in response to the prevailing consolidation patterns.
Signal Confirmation
To enhance the reliability of Aroon indicator signals, confirming them through price action, volume analysis, and other technical indicators is crucial. Here's how you can effectively confirm Aroon signals:
- Validate trend changes and entry/exit points by analyzing price action alongside Aroon signals.
- Combine Aroon indicator signals with other technical tools to enhance accuracy and reduce false signals.
- Improve the reliability of trend reversal signals by confirming Aroon crossovers with increased trading volume.
- Strengthen the validity of Aroon indicator signals by looking for consistent confirmation patterns across multiple indicators.
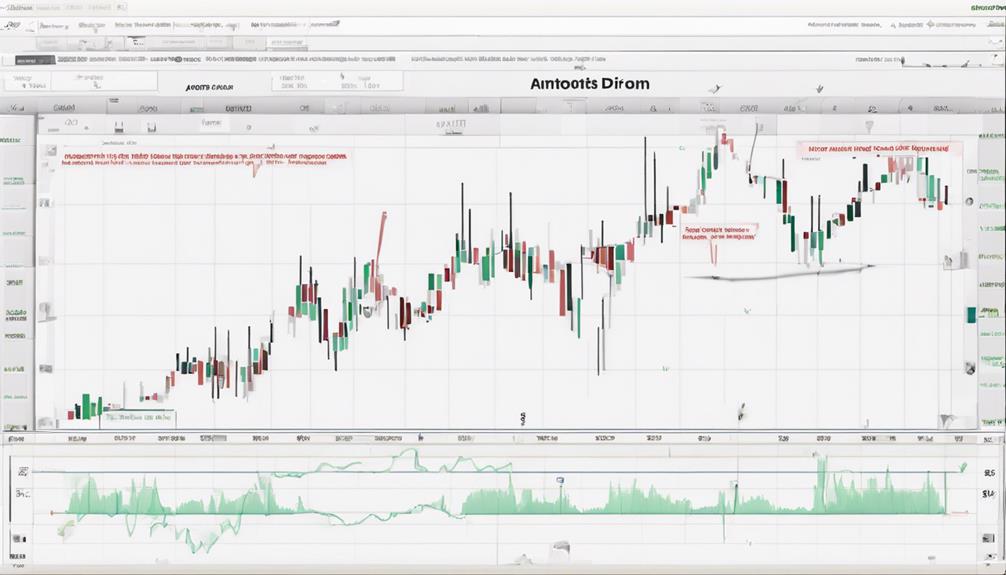
Price Reversal Points
When analyzing price reversal points using the Aroon Indicator, you can pinpoint potential shifts in market sentiment.
Aroon's ability to identify trend changes by signaling reversals provides traders with valuable insights for decision-making.
Utilizing these reversal points can enhance your technical analysis strategy and aid in making informed trading choices.
Signal Price Reversals
Signal price reversals are identified by the Aroon Indicator when Aroon-Up crosses below Aroon-Down. When this crossover occurs, it can indicate a potential shift in the ongoing trend. Utilizing the Aroon Indicator for spotting price reversal points can greatly aid traders in making timely entry or exit decisions.
Here are key points to consider when analyzing price reversals with the Aroon Indicator:
- Aroon Indicator signals price reversals by Aroon-Up crossing below Aroon-Down.
- Price reversal points are crucial for identifying potential trend changes.
- Critical levels are highlighted by the Aroon Indicator for decision-making.
- Recognizing when Aroon-Up falls below Aroon-Down assists in anticipating trend reversals effectively.
Identify Trend Changes
Utilize the Aroon Indicator to effectively pinpoint trend changes, specifically focusing on identifying price reversal points for strategic decision-making in technical analysis.
The Aroon Indicator assists in recognizing potential uptrend reversals when Aroon-Up crosses above Aroon-Down, and potential downtrend reversals when Aroon-Down crosses above Aroon-Up.
To confirm trend changes, look for Aroon crossovers near key support or resistance levels. Additionally, the indicator helps in identifying critical price levels where trend reversals may occur.
By paying attention to these crossovers and levels, you can enhance your ability to anticipate and react to shifts in market sentiment promptly.
Integrating the Aroon Indicator into your technical analysis toolkit can provide valuable insights into trend dynamics and price reversal points.
Divergence Analysis
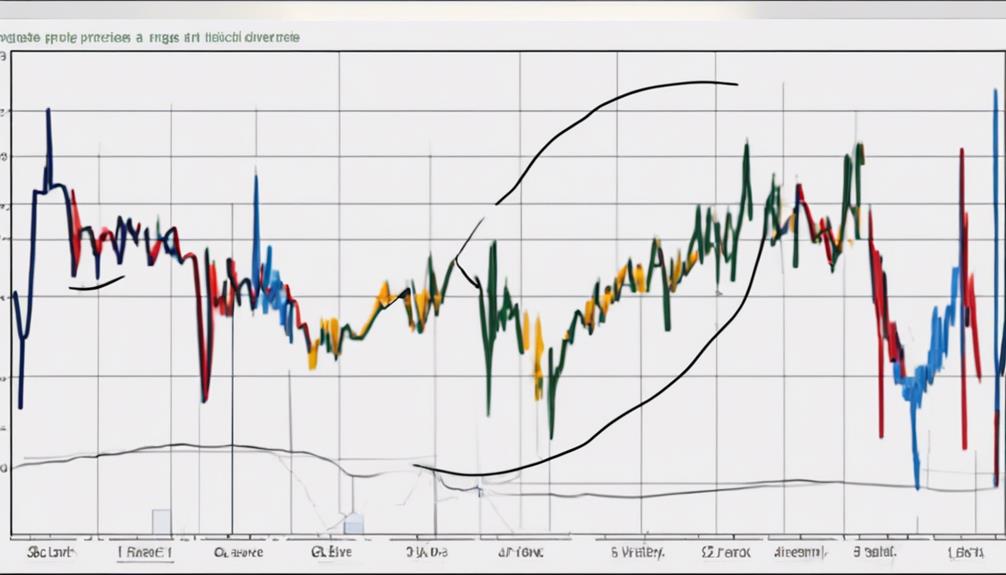
In divergence analysis, traders compare price movements with Aroon Indicator signals to spot potential trend reversals. This analysis helps identify inconsistencies between price action and Aroon Indicator readings, providing early warnings of market reversals.
Here are key points to consider:
- Bullish divergence: New price lows aren't confirmed by the Aroon Indicator.
- Bearish divergence: New price highs aren't confirmed by the Aroon Indicator.
- Divergence analysis gives insights into potential trend changes.
- It can signal market reversals before they occur, aiding traders in making informed decisions.
Combining With Other Indicators
To enhance your technical analysis approach, consider integrating the Aroon Indicator with various other indicators for improved trend identification and signal accuracy. Combining it with Moving Averages can help confirm trend direction and filter out false signals.
Pairing the Aroon Indicator with RSI enhances trend confirmation and provides valuable entry/exit signals. Utilizing it alongside MACD offers a comprehensive trend analysis and confirms momentum.
Integration with Bollinger Bands aids in identifying potential trend reversals and shifts in volatility. When combined with Fibonacci retracement levels, the Aroon Indicator assists in pinpointing crucial support and resistance levels, aiding in making more informed trading decisions.
Experimenting with these combinations can lead to a more robust technical analysis strategy.
Risk Management Strategies
Consider implementing risk management strategies such as setting stop-loss orders to protect against potential losses. To effectively manage risks when using the Aroon Indicator in technical analysis, follow these tips:
- Set Stop-Loss Orders: Use stop-loss orders to limit losses and protect your capital.
- Diversify Your Portfolio: Spread risk by investing in various assets to reduce exposure to any single asset.
- Combine Indicators: Enhance risk management by combining Aroon Indicator signals with other technical indicators.
- Practice on a Demo Account: Before live trading, practice risk management techniques on a demo account to refine your approach.
Understanding and implementing robust risk management strategies are crucial for managing risks, safeguarding your capital, and ensuring long-term success in trading.
What Are Some Advanced Strategies for Using the Aroon Indicator in Technical Analysis?
When utilizing the Aroon indicator in technical analysis, there are several advanced tips for Aroon indicator that can be beneficial. One is looking for confluence with other indicators to confirm signals. Another tip is using multiple timeframes to get a clearer picture of the trend strength.
Frequently Asked Questions
What Is the Aroon Indicator Used For?
The Aroon Indicator is used to identify trend changes and measure trend strength based on time between highs and lows. It helps you determine the direction of price movements by analyzing trend strength relative to each other.
How Accurate Is the Aroon Indicator?
When using the Aroon Indicator, you'll find it to be accurate in identifying trend changes and strength based on recent highs and lows. Its crossovers offer reliable signals for potential entry or exit points.
What Is the Aroon Crossover Strategy?
The Aroon Crossover Strategy signals trend shifts when Aroon-Up crosses Aroon-Down for uptrend potential or vice versa for a downtrend. This technique offers traders clear entry/exit points based on these line interactions.
What Is the Difference Between RSI and Aroon Indicator?
RSI measures price momentum, while Aroon Indicator tracks time between highs and lows. RSI indicates overbought or oversold conditions, Aroon signals trend strength and direction changes. Both offer unique insights in technical analysis.
Conclusion
In conclusion, utilizing the Aroon Indicator in technical analysis can greatly enhance your trading strategies. Despite potential objections about its complexity, the Aroon Indicator provides valuable insights into trend strength and direction, aiding in identifying potential trend changes, consolidation patterns, and signal confirmations.
By combining it with other indicators and implementing risk management strategies, you can effectively navigate the markets and make informed trading decisions. Start incorporating the Aroon Indicator into your analysis today for improved trading outcomes.