
In the realm of technical analysis, the Williams %R Indicator stands as a pivotal tool for traders seeking to navigate the complexities of the market with precision. From its inception by Larry Williams to its practical application across various trading strategies, the indicator offers a wealth of information waiting to be harnessed.
As we delve into the intricacies of this three-part technical guide, the potential for refining trading decisions and honing one's strategic approach becomes increasingly apparent. The Williams %R Indicator serves as a beacon for traders, illuminating pathways to enhanced analysis and optimized trading outcomes.
Williams %R Formula and Calculation
The Williams %R Formula is a technical indicator that serves as a powerful tool for analyzing market dynamics by comparing the highest high, lowest low, and current closing price. The calculation involves subtracting the current closing price from the highest high and dividing by the highest high minus the lowest low. This value is then multiplied by -100 to provide a reading ranging from -100 to 0.
Traders utilize the Williams %R Indicator to determine overbought and oversold conditions based on recent price movements, enabling them to make informed decisions about market entry and exit points. Typically calculated over a 14-day period, this indicator offers insights into market momentum and potential trend reversals.
Understanding Williams %R Chart Examples
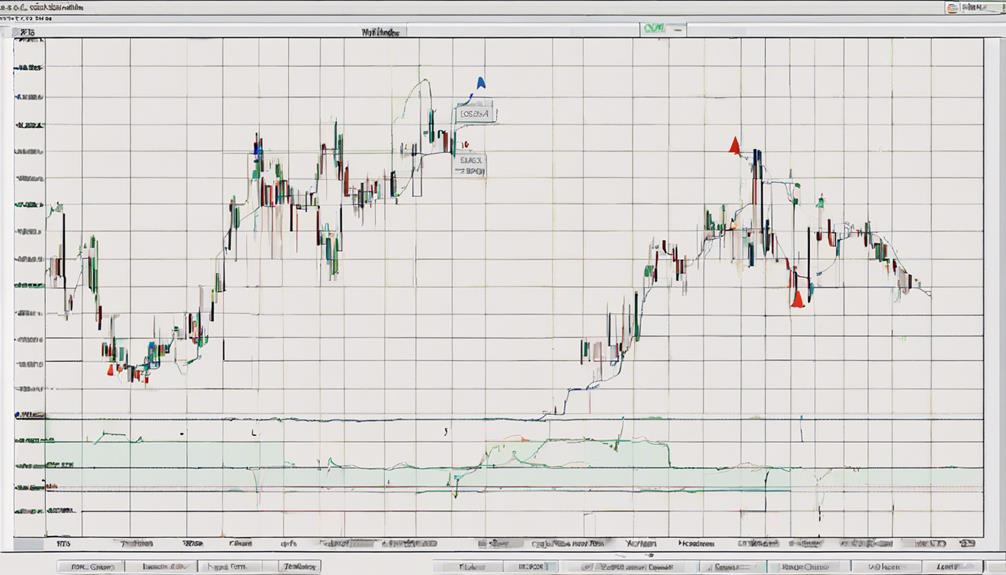
Illustrating Williams %R chart examples provides valuable insights into market volatility and momentum shifts in securities, aiding traders in making informed decisions based on technical analysis.
The Williams %R indicator, ranging from -100 to 0, is a momentum indicator that helps traders identify overbought and oversold levels. When the indicator falls below -80, it suggests oversold conditions, indicating a possible buying opportunity. Conversely, readings above -20 indicate overbought conditions, signaling a potential selling opportunity.
By analyzing Williams %R chart examples, traders can observe how the indicator reacts to high and low prices, thus gauging the market's volatility and potential trend reversals. Different trading strategies incorporate Williams %R signals to make timely decisions, such as using crossovers or divergence patterns to confirm possible price movements.
Understanding these chart examples is essential for traders looking to leverage the Williams %R indicator effectively in their technical analysis.
Relationship Between Williams %R and Stochastic Oscillator
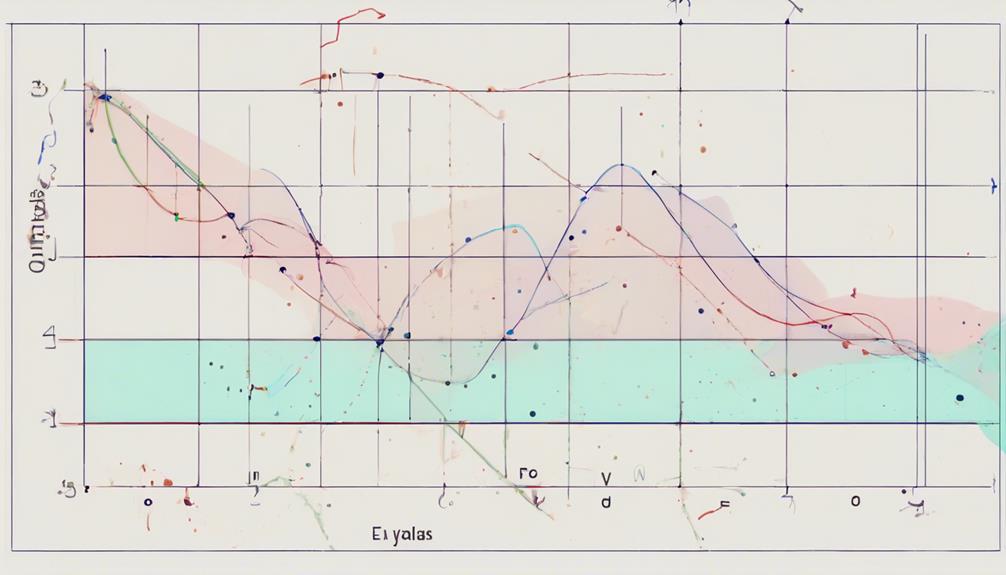
Comparing Williams %R and the Stochastic Oscillator reveals their complementary perspectives on price movements in the financial markets. Williams %R is the inverse of the Stochastic Oscillator, offering a different viewpoint by comparing the closing price to the highest price over a specified period, while the Stochastic Oscillator compares it to the lowest price.
The multiplication factor of -100 in Williams %R and 100 in the Stochastic Oscillator influences the scale of the indicators' values, affecting their interpretation. Both indicators showcase similar movement patterns, which can aid in trend analysis and momentum identification. However, the Stochastic Oscillator includes a trigger line for entry and exit signals, providing additional guidance compared to Williams %R.
Understanding the relationship between these two indicators can enhance the depth of analysis and decision-making in trading strategies by leveraging their unique features for comprehensive market evaluation.
Three Trading Strategies for Williams %R Indicator
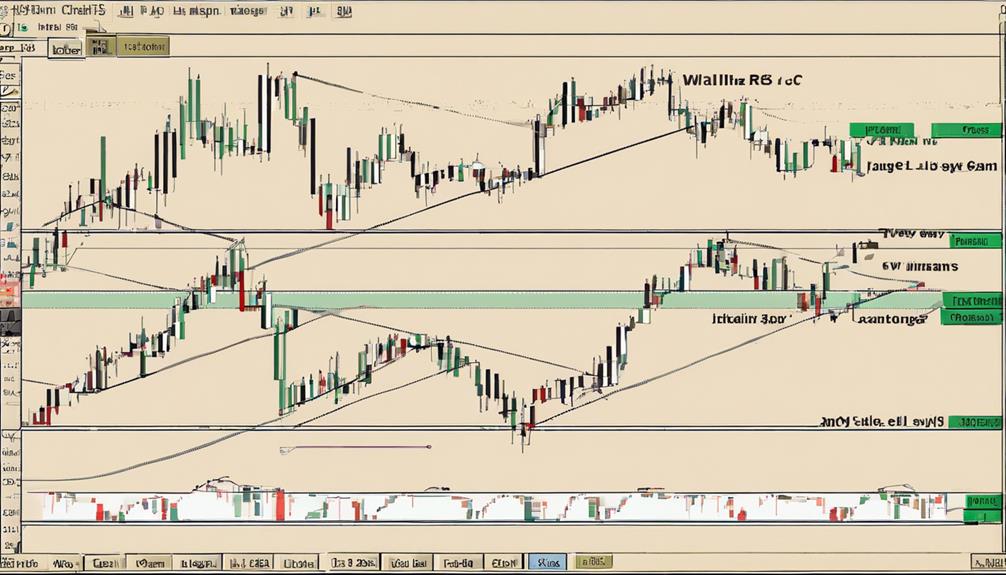
Building on the insights gained from understanding the relationship between Williams %R and the Stochastic Oscillator, exploring three effective trading strategies for the Williams %R indicator can provide valuable tools for informed decision-making in the financial markets.
- Utilize the -50 line cross on Williams %R to identify momentum shifts in trading.
- Look for divergences between price and Williams %R for trend continuation signals.
- Ride the Williams by entering trades when %R breaks below -20 and stays below -30 for trend riding opportunities.
Combining price action with Williams %R signals can enhance trading accuracy and decision-making.
These strategies offer different approaches to using the Williams %R Indicator for making informed trading decisions. By incorporating these methods into a trading plan, traders can potentially capitalize on market movements more effectively, anticipate trend changes, and improve overall trading performance.
The intersection of technical analysis and strategic implementation based on the Williams %R Indicator can facilitate better risk management and increased profitability in the dynamic environment of financial markets.
Exploring External References for Williams %R
Exploring external references for the Williams %R indicator offers traders valuable insights and resources to enhance their understanding and utilization of this technical analysis tool. Larry Williams' original publications and books on technical analysis serve as foundational resources for traders looking to delve deeper into the intricacies of the Williams %R indicator.
Online trading platforms and websites provide detailed guides and tutorials on effectively using Williams %R in trading strategies. Additionally, financial news websites frequently discuss the application of Williams %R in current market conditions, shedding light on its relevance in different scenarios.
Professional trading forums and communities offer real-life experiences and insights on integrating Williams %R into trading practices, enriching traders with practical knowledge. Educational resources such as Investopedia and StockCharts further contribute to traders' comprehension by providing in-depth explanations and examples of Williams %R, enabling traders and investors to make informed decisions based on momentum, oversold, and overbought signals in the market.
Can I Use the Three-Part Technical Guide for Williams %R Indicator as a Beginner?
Yes, you can use the three-part technical guide for Williams %R indicator as a beginner. The beginners guide Williams indicator provides clear and concise instructions for understanding and implementing this powerful tool in your trading strategy. It is designed to help beginners grasp the concept and make informed decisions.
Frequently Asked Questions
How Do You Read a Williams R Indicator?
To read a Williams %R indicator, analyze values below -80 for oversold conditions and above -20 for overbought signals. Extreme values near 0 indicate the security is trading at its highest. Compare current prices to historical highs/lows for trend insights.
What Is the Best Setting for the Williams %R Indicator?
In determining the optimal setting for the Williams %R indicator, traders should consider the default 14-period setting as a foundational starting point. By adjusting these periods, individuals can tailor the indicator to align with their unique trading strategies and preferences.
What Is the Difference Between RSI and Williams R Indicator?
The Relative Strength Index (RSI) and Williams %R indicator both measure price momentum but differ in their range and sensitivity. RSI ranges from 0 to 100, signaling overbought and oversold levels, while Williams %R ranges from -100 to 0, offering quicker signals.
What Is the Triple Indicator Strategy?
The Triple Indicator Strategy combines Williams %R, MACD, and RSI to confirm trading signals and enhance accuracy. Traders rely on the unique insights provided by each indicator to make informed decisions and capitalize on market opportunities.
Conclusion
In conclusion, the Three-Part Technical Guide on the Williams %R Indicator provides valuable insights into utilizing this momentum oscillator effectively in trading. By understanding the formula, calculation, and application of Williams %R, traders can make more informed decisions in the market.
Despite its effectiveness, some traders may argue that relying solely on technical indicators like Williams %R may not always guarantee success. However, when used in conjunction with other tools and strategies, it can significantly enhance trading accuracy and profitability.