
Understanding the top 10 candlestick patterns is essential for any day trader. These include Hammer, Morning Star, Bullish Engulfing, Shooting Star, Hanging Man, Doji, Piercing Line, Dark Cloud Cover, and Three Black Crows. These patterns provide valuable insights into potential market reversals, shifts in sentiment, and entry/exit points for trades. Recognizing these formations can enhance trading decisions and improve risk management strategies. By mastering these patterns, traders gain a competitive edge in analyzing price movements and making informed trading choices based on market dynamics. Mastering these patterns can greatly impact a trader's success in the financial markets.
Hammer
In the domain of candlestick patterns, the Hammer stands out as a notable bullish reversal signal that emerges at the conclusion of a downtrend. This pattern is characterized by a small real body at the top of the candlestick with a long lower wick.
The presence of a long lower wick in the Hammer pattern indicates that while sellers pushed the price lower during the trading session, buyers were able to exert enough pressure to bring the price back up by the close. This dynamic showcases a shift in momentum from bearish to bullish, suggesting a potential trend reversal to the upside.
Traders often view the Hammer as a signal to anticipate a bullish move in the market. However, it is vital for traders to seek confirmation of the bullish reversal before entering a trade based solely on the appearance of the Hammer pattern, as confirmation helps validate the shift in sentiment from sellers to buyers.
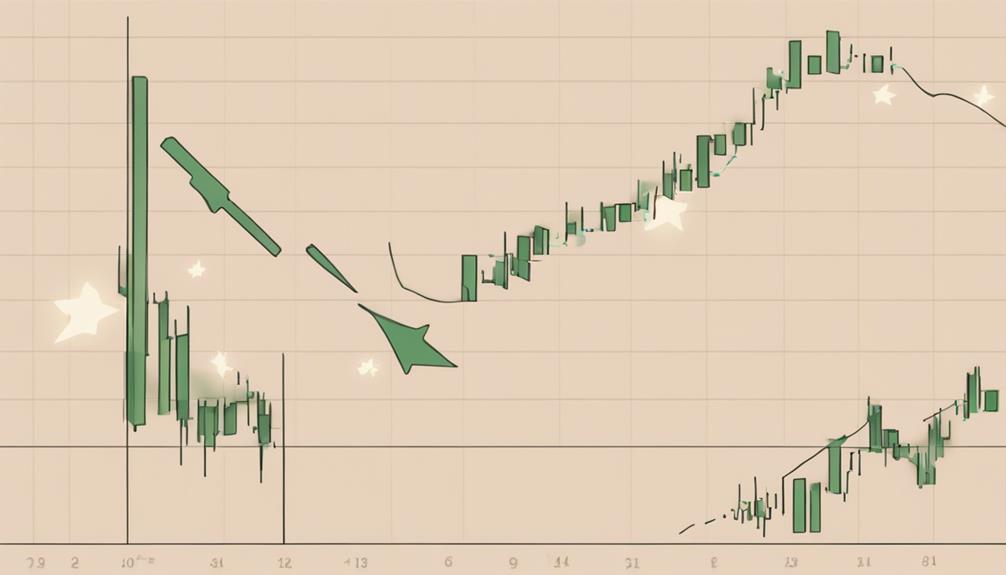
Morning Star
After discussing the Hammer pattern as a notable bullish reversal signal in candlestick analysis, the focus now shifts to the Morning Star pattern, which is a three-candle formation signaling a potential reversal from a downtrend to an uptrend.
The Morning Star pattern consists of three candles: the first candle is bearish, the second is a small doji or spinning top indicating indecision, and the third candle is a bullish candle showing an increase in buying pressure. This pattern suggests a shift in market sentiment from bearish to bullish. Confirmation of the Morning Star pattern is essential as it strengthens the indication of a bullish reversal.
Traders often look for the Morning Star pattern as a signal of a potential change in market direction, making it a valuable tool in analyzing and predicting market movements. Understanding and recognizing candlestick patterns like the Morning Star can help traders make informed decisions and improve their trading strategies.
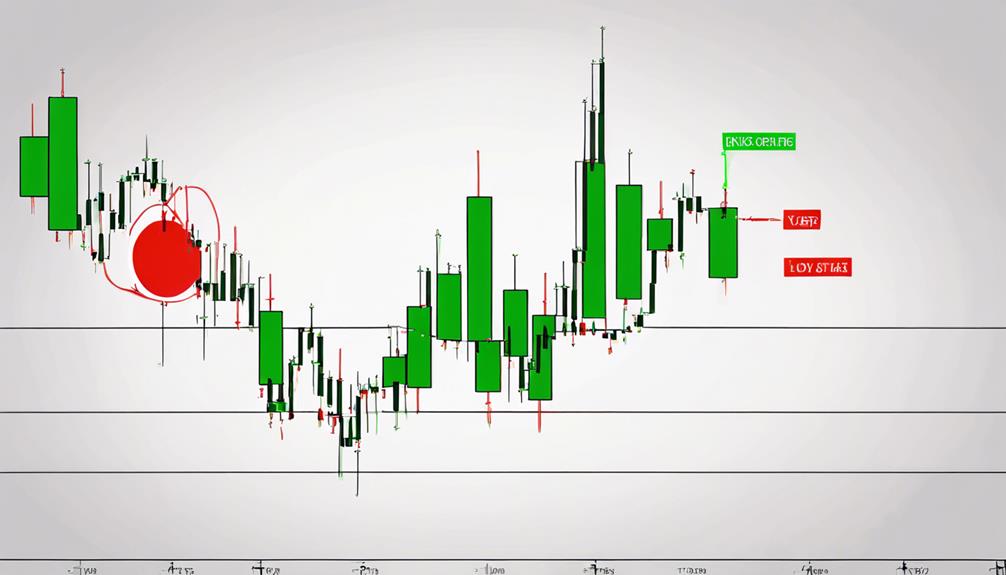
Bullish Engulfing
A compelling signal of potential bullish reversal in candlestick analysis is the Bullish Engulfing pattern, characterized by a two-candle formation where the second candle fully engulfs the first. This pattern typically emerges after a downtrend and signifies a shift in momentum towards bullish sentiment.
The first candle is bearish, followed by a larger bullish candle that completely covers the body of the previous candle. The engulfing of the prior candle's range by the second candle indicates a significant increase in buying pressure, suggesting that buyers have gained control and are likely to drive prices higher.
Traders keen on capturing potential price upswings often interpret Bullish Engulfing patterns as strong signals to enter long positions in anticipation of further price appreciation. By recognizing this pattern and understanding its implications within the context of a downtrend, traders can strategically position themselves to benefit from the expected bullish reversal.
Shooting Star
Characterized by a small real body near the day's low and a long upper wick resembling a falling star, the Shooting Star is a bearish candlestick pattern that indicates a potential trend reversal in an uptrend. When analyzing the Shooting Star pattern, traders focus on specific characteristics to assess the strength of the potential reversal signal:
- Real Body and Wick Proportions: The length of the upper wick should be at least twice the size of the real body for a more robust indication of a reversal.
- Momentum Shift: Traders often look for Shooting Stars after a prolonged uptrend as a warning sign that the market's momentum may be waning.
- Follow-Through Selling: Confirmation from follow-through selling in the subsequent trading session is essential to validate the bearish signal of the Shooting Star pattern.
- Trend Reversal Potential: The appearance of a Shooting Star suggests a possible shift in market sentiment from bullish to bearish, prompting traders to contemplate potential short positions and risk management strategies.
Hanging Man
The Hanging Man candlestick pattern is a bearish reversal signal observed at the end of an uptrend. It signifies a potential shift in market sentiment as buyers struggle to maintain control.
Traders keen on interpreting this pattern should consider it as an indication of price rejection and a pivotal moment for evaluating their long positions.
Bearish Reversal Signal
At the conclusion of an uptrend, day traders can observe a bearish reversal signal known as the Hanging Man pattern. This candlestick pattern features a small body near the low of the candle and a long upper shadow, indicating potential selling pressure and a shift towards a bearish trend. To effectively utilize this pattern, traders must seek verification to guarantee accurate interpretation for their trading decisions.
Combining the identification of the Hanging Man pattern with other technical indicators can greatly enhance its predictive power in determining market direction.
- Small body near the low of the candle.
- Long upper shadow indicating potential selling pressure.
- Expectation of a trend reversal from bullish to bearish.
- Importance of verification and using technical indicators for enhanced prediction.
Price Rejection Indication
Signifying potential market shifts, the Price Rejection Indication, commonly represented by the Hanging Man candlestick pattern, serves as an essential tool for day traders seeking to anticipate trend reversals.
This bearish candlestick pattern typically occurs at the end of an uptrend, characterized by a small real body near the low of the day and a long lower wick, resembling a hanging man. The pattern suggests that buyers are losing control, potentially leading to increased selling pressure.
Traders often wait for confirmation in the subsequent candles to validate the Hanging Man pattern before making trading decisions. Recognizing this formation can help traders adjust their trading strategies accordingly to navigate potential trend reversals effectively.
Single Candle Formation
An important bearish candlestick pattern that day traders often monitor for potential trend reversals is the Hanging Man, denoting a shift in market sentiment at the conclusion of an uptrend.
- The Hanging Man signifies a bearish reversal and is characterized by a small body near the low with a long lower wick, resembling a hanging man.
- This pattern suggests potential market weakness and indicates a possible trend reversal to the downside.
- Traders should seek confirmation signals after identifying the Hanging Man pattern to make well-informed trading decisions.
- It is crucial to take into account the broader market conditions and context when interpreting the Hanging Man pattern to gauge its reliability accurately.
Inverted Hammer
The Inverted Hammer is a significant candlestick pattern in technical analysis due to its potential to signal a bullish reversal. Traders closely observe this pattern during downtrends, anticipating a shift in market sentiment towards bullish momentum.
Verification from subsequent price movements is essential for traders to validate the Inverted Hammer's signaling of a possible uptrend.
Inverted Hammer Definition
After a downtrend, the Inverted Hammer candlestick pattern emerges as a bullish indicator of potential price reversal in financial markets. The key characteristics of this pattern include:
- A small body with a long upper wick.
- Occurs after a downtrend, signaling a potential price reversal.
- Indicates a shift from selling pressure to buying pressure.
- Confirmation from subsequent price action is vital when identifying the Inverted Hammer pattern.
Traders often watch for the Inverted Hammer pattern as it suggests a possible change in market sentiment from bearish to bullish. By understanding the dynamics of this candlestick pattern, traders can make more informed decisions when planning their trading strategies.
Inverted Hammer Trading Strategies
Utilizing effective trading strategies centered around the Inverted Hammer candlestick pattern can provide day traders with valuable insights for managing potential market reversals.
The Inverted Hammer, a bullish reversal pattern that emerges at the end of a downtrend, signifies a shift from bearish to bullish sentiment. Its small body at the top of the price range coupled with a long lower shadow indicates increased buying pressure. Traders typically seek confirmation through subsequent price movements to validate the pattern's significance.
Understanding the context in which the Inverted Hammer forms is essential for making well-informed trading decisions. By recognizing this pattern and its implications, traders can enhance their ability to identify trend changes and capitalize on opportunities in the market effectively.
Doji

Symbolizing market indecision or potential trend reversals, the Doji candlestick pattern features a small body with long upper and lower wicks, representing equilibrium between buyers and sellers.
Here are some key points to understand the Doji pattern:
- Market Indecision: The Doji signifies uncertainty in the market, showing that neither buyers nor sellers are in control.
- Trend Reversal: Its appearance can suggest a possible shift in market sentiment, indicating a potential reversal in the current trend.
- Balance Between Buyers and Sellers: The long upper and lower wicks of the Doji reflect a battle between buyers and sellers, leading to a standoff.
- Consolidation and Significant Price Movements: Traders often interpret the Doji as a period of consolidation before a breakout or as a signal for upcoming significant price movements.
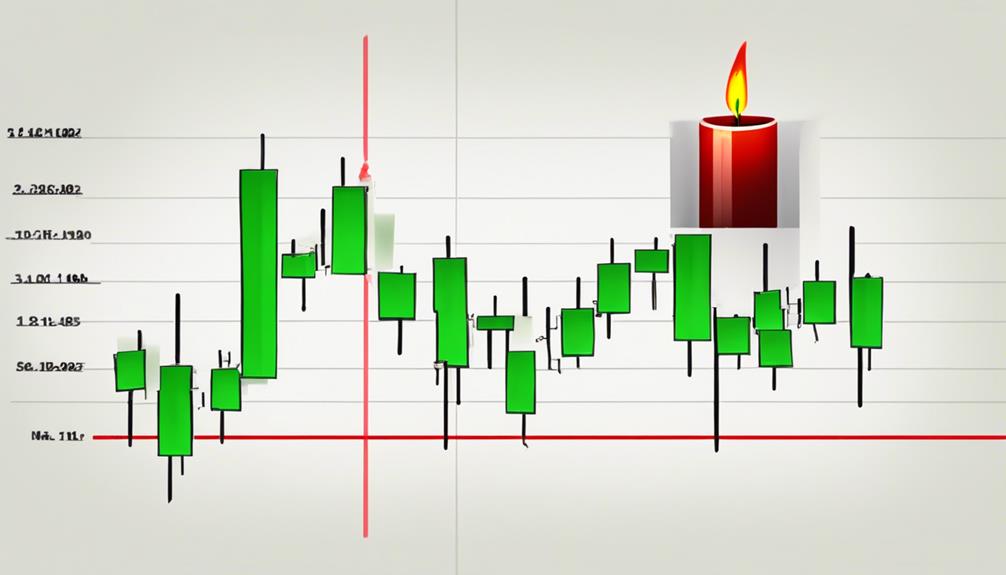
Piercing Line
The Piercing Line candlestick pattern signals a potential bullish reversal in market sentiment with its distinctive formation of two candles. This pattern starts with a large red (or bearish) candle, followed by a second large green (or bullish) candle. The second candle opens below the low of the first candle but manages to close above the midpoint of the first candle.
This shift from a red candle to a green candle suggests that buying pressure is overcoming selling pressure, indicating a possible reversal of a downtrend. Traders often wait for confirmation of the Piercing Line pattern through follow-through bullish price action. This confirmation helps in solidifying the belief that the trend may indeed be reversing.
It is essential for traders to pay attention to the context in which the Piercing Line appears and to take into account other technical indicators to make well-informed trading decisions based on this candlestick pattern.
Dark Cloud Cover
In the domain of candlestick patterns, the Dark Cloud Cover signifies a bearish reversal pattern commonly observed in uptrends. This pattern can provide valuable insights into potential market downturns and is akin to the Bearish Engulfing pattern but with specific criteria. To understand the Dark Cloud Cover better, traders should focus on the following key points:
- Pattern Description: The Dark Cloud Cover consists of two candles, with the second candle opening above the first candle's high and closing below its midpoint.
- Signaling Bearish Sentiment: This pattern is formed when the second candle's close is below the midpoint of the first candle, indicating a shift towards bearish sentiment in the market.
- Confirmation Signals: Traders often look for confirmation signals to validate the Dark Cloud Cover pattern and make informed trading decisions.
- Differentiation from Bearish Engulfing: While similar to the Bearish Engulfing pattern, the Dark Cloud Cover has specific criteria related to the second candle's close and midpoint placement.
Three Black Crows
Three Black Crows is a bearish candlestick pattern that signifies a strong reversal in a downtrend through the formation of three consecutive long red candles with lower lows and lower highs. This pattern indicates potential selling pressure in the market as each candle opens lower than the previous one, emphasizing the continuation of bearish sentiment.
Traders often seek confirmation signals such as increased volume or breaches of support levels when identifying Three Black Crows for making trading decisions. Recognizing this pattern can assist traders in anticipating and profiting from potential bearish trends in the market.
Which Candlestick Patterns Are Most Important for Market Trend Analysis?
When it comes to analyzing market trends, certain candlestick patterns for market are particularly important. The bearish and bullish engulfing patterns, as well as the doji and hammer patterns, can provide valuable insights into the direction of a market trend. Traders often rely on these patterns when making strategic decisions.
Frequently Asked Questions
What Is the Best Candlestick Pattern for Day Trading?
The best candlestick pattern for day trading is the bullish engulfing pattern, signifying a potential upward reversal. This pattern involves two candles, with the second one fully engulfing the first, indicating robust buying momentum.
Day traders often seek bullish engulfing patterns at important support levels for potential long trades. It is considered reliable when accompanied by high trading volume, enhancing the chances of a successful trade.
Traders utilize bullish engulfing patterns as entry signals to profit from short-term market price movements.
What Is the Most Successful Candlestick Pattern?
The most successful candlestick pattern, the Bullish Engulfing pattern, signifies a significant reversal in market sentiment.
This two-candle pattern involves a large bullish candle completely engulfing the prior smaller bearish candle.
Traders often rely on this pattern to indicate the potential commencement of a bullish trend.
When identified in suitable market conditions, the Bullish Engulfing pattern is highly reliable and offers profitable trading opportunities.
Which Candlestick Is Best for Trading?
When considering which candlestick is best for trading, traders often assess various factors such as market conditions, timeframes, and their trading strategy.
Some commonly used candlestick patterns include the Bullish Engulfing, Doji Star, and Hammer Hangman. Each pattern has distinct characteristics that traders analyze to identify potential trading opportunities.
Incorporating candlestick analysis alongside other technical indicators can provide traders with more robust signals for making informed trading decisions.
What Is the 3 Candle Rule?
The 3 Candle Rule is a candlestick interpretation technique used in market analysis and trading strategies. It involves pattern recognition through observing three consecutive candles moving in the same direction to identify potential trend confirmation.
This rule aids in price action analysis, technical analysis, trend identification, entry signals, and exit strategies. By incorporating the 3 Candle Rule, traders can enhance their risk management and make more informed decisions in the market.
Conclusion
In summary, mastering the top 10 candlestick patterns is essential for every day trader's success in the market.
These patterns provide valuable insights into market trends and potential price movements, helping traders make informed decisions.
By understanding and recognizing these patterns, traders can improve their trading strategies and increase their chances of profitability.
Embracing the art of candlestick analysis is key to maneuvering through the complexities of the financial markets with finesse and precision.